
Figures & data
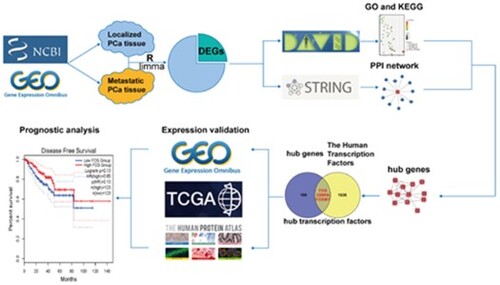
Figure 1. Flowchart of this study. GSE, Gene Expression Omnibus (GEO) Series; DEGs, differentially expressed genes; DAVID, The Database for Annotation, Visualization and Integrated Discovery; GO, Gene Ontology; KEGG, Kyoto Encyclopedia of Genes and Genomes; PPI, Protein-Protein Interactions; GEO, Gene Expression Omnibus; TCGA, The Cancer Genome Atlas.
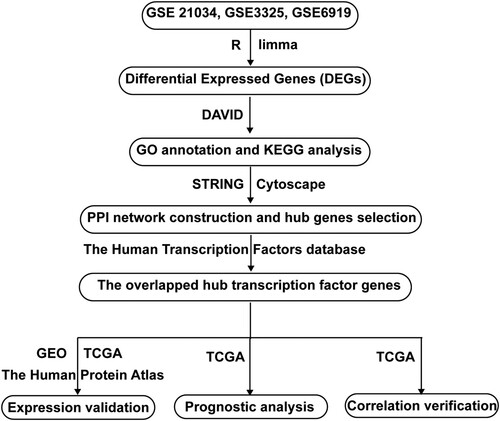
Figure 2. Identification of the DEGs. (a) Volcano plots of microarrays from GSE21034, GSE3325, and GSE6919. The red nodes represent up-regulated DEGs. The green nodes indicate down-regulated DEGs. (b) Venn diagrams of the overlapping up-regulated DEGs between the three indicated microarrays. (c) Venn diagrams of the overlapping down-regulated DEGs between the three indicated microarrays.
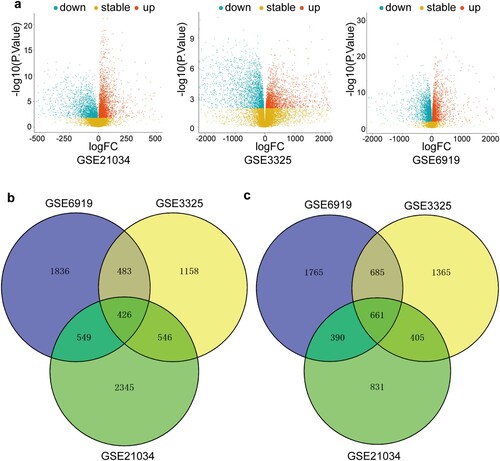
Figure 3. GO annotation and KEGG pathway enrichment analysis of the overlapping DEGs and protein-protein interactions (PPI) network construction. (a) GO enrichment analysis and KEGG pathway enrichment analysis of the overlapping DEGs. (b) PPI network of the overlapping DEGs. The red nodes represent up-regulated DEGs. The blue nodes indicate down-regulated DEGs.
Figure 4. Identification and validation of hub transcription factor genes. (a) Venn diagrams of 103 hub genes in the PPI network and 1639 transcription factors from The Human Transcription Factors database. (b) mRNA expression of the three hub transcription factor genes in localized PCa (T) and metastatic PCa (M) in the three GEO datasets. (c) mRNA expression of the three hub transcription factor genes in normal prostate samples (Normal), localized PCa (N0), and metastatic PCa (N1) from TCGA database. * P < 0.05; ** P < 0.01; *** P < 0.001. P < 0.05 was considered statistically significant. Student's t-test was used. (d) Disease-free survival curves of localized PCa patients with different expression of the three hub transcription factor genes.
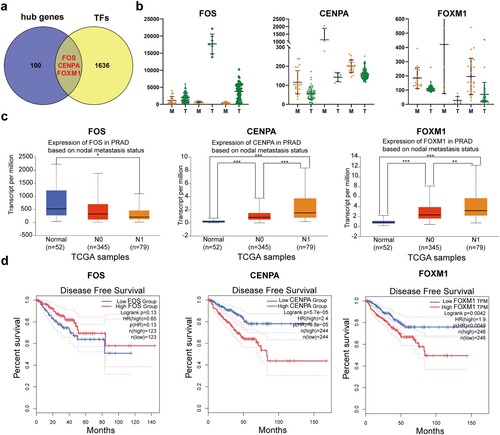
Figure 5. Functional analysis of FOS related genes. (a) GO annotation and KEGG pathway enrichment analysis of FOS related genes. (b) PPI network of FOS related genes. (c) Correlation validation of the top five FOS related genes (DUSP1, ILK, ZFP36, NR4A2, EGR2) in the PPI network was performed in the TCGA database.
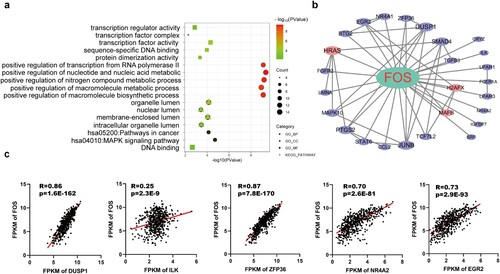
Figure 6. Functional analysis of FOXM1 and CENPA related genes. (a) GO annotation and KEGG pathway enrichment analysis of FOXM1 related genes and CENPA related genes. (b) PPI networks of FOXM1 related genes and CENPA related genes. (c) Correlation validation of the top five FOXM1 related genes (H2AX, CDCA3, ANLN, TPX2, CDCA5) in the PPI network was performed in the TCGA database. (d) Correlation validation of the top five CENPA related genes (CDKN2A, CDC20, KIF11, PTTG1, CENPF) in the PPI network was conducted in the TCGA database.
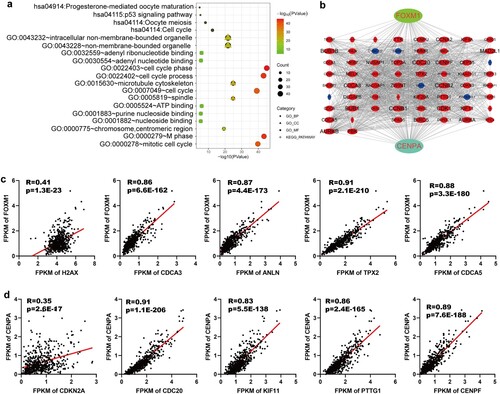
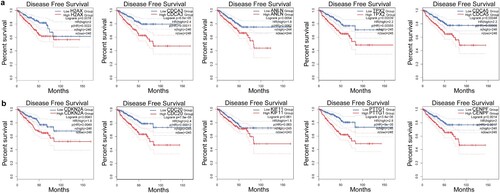
Figure 7. The clinical significance of the top five FOXM1 and CENPA related genes. (a) Kaplan-Meier plots of disease-free survival for localized PCa patients with different expression of the top five FOXM1 related genes. (b) Kaplan-Meier plots of disease-free survival for localized PCa patients with different expression of the top five CENPA related genes.
Supplemental Material
Download Zip (33.7 MB)Data availability statement
The data and materials supporting the results or analyses presented in our paper are freely available. The data are deposited at the below sites: https://doi.org/10.6084/m9.figshare.14226992.v1; (manuscript) https://doi.org/10.6084/m9.figshare.14227058.v1; (figures)