
Figures & data
Figure 1. GROα is upregulated in liver cancer and its expression is declined by aloperine. (A) Expression analysis of GROα from 79 paired liver cancer and normal adjacent tissues. (B) Analysis of transcript levels of GROα from liver cancer cell lines (SNU-182, SNU-423, SNU-449 and HepG2) and TLE-2 normal liver epithelial cells using GAPDH as reference (C) Analysis of transcript levels of GROα from liver cancer cell lines (SNU-182, SNU-423, SNU-449 and HepG2) and TLE-2 normal liver epithelial cells using actin as reference (D) Effect of aloperine (5 µM) treatment on GROα transcript levels in SNU-182 cells (E) Effect of aloperine (5 µM) treatment on GROα transcript levels in SNU-449 cells (F) Effect of aloperine (5 µM) treatment on GROα protein levels in SNU-182 cells (G) Effect of aloperine (5 µM) treatment on GROα protein levels in SNU-449 cells Three replicates were used for performing the experiments and the data is presented as mean ± SD (*P < .05).
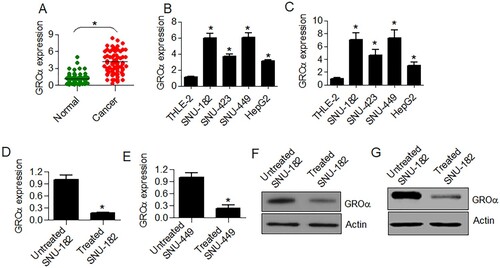
Figure 2. Aloperine inhibits the proliferation of liver cancer cells via GROα mediated G2/M cell cycle arrest. (A) Analysis of viability of SNU-182 and THLE-2 cells treated with aloperine at concentrations of 0–80 µM (B) assessment of proliferation rate of SNU-182 cancer cells down-regulating GROα with reference to control transfected cells at different culture durations (C) flow cytometric cell cycle analysis of SNU-182 cells transfected with si-GROα or si-NC (D) assessment of proliferation rate of SNU-182 cancer cells transfected with si-GROα or treated with aloperine (5 µM) and aloperine treated and overexpressing GROα with reference to corresponding negative control cells at different culture durations (E) flow cytometric cell cycle analysis of aloperine treated or aloperine treated and GROα over-expressing SNU-182 cells with reference to untreated cancer cells. Three replicates were used for performing the experiments and the data is presented as mean ± SD (*P < .05).
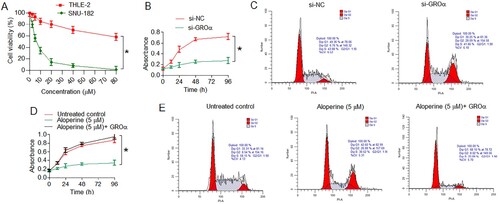
Figure 3. Aloperine targets GROα to inhibit migration of liver cancer cells. Examination of migration of si-GROα transfected, aloperine treated or aloperine treated GROα over-expressing SNU-182 cells by transwell chamber method with reference to corresponding negative control cells. Three replicates were used for performing the experiments and the data is presented as mean ± SD (*P < .05 for si-NC vs. si-GROα, @P for untreated control vs. Aloperine (5 µM) and #P < 0.05 for Aloperine (5 µM) vs. Aloperine (5 µM) + GROα).
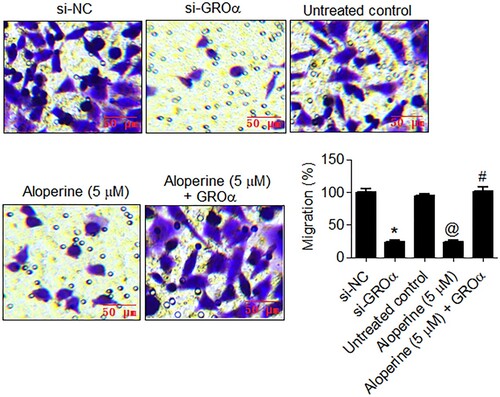
Figure 4. Aloperine targets GROα to inhibit invasion of liver cancer cells. Examination of invasion of si-GROα transfected, aloperine treated or aloperine treated GROα over-expressing SNU-182 cells by transwell chamber method with reference to corresponding negative control cells. Three replicates were used for performing the experiments and the data is presented as mean ± SD (*P < .05 for si-NC vs. si-GROα, @P for untreated control vs. Aloperine (5 µM) and #P < .05 for Aloperine (5 µM) vs. Aloperine (5 µM) + GROα).
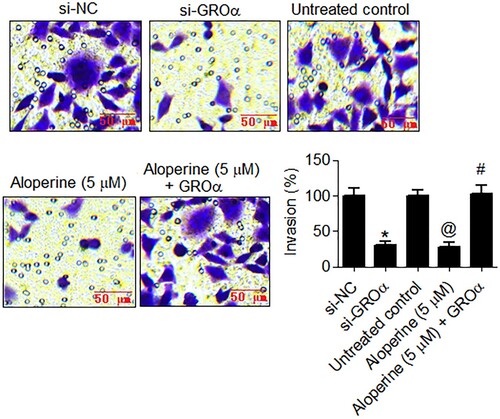
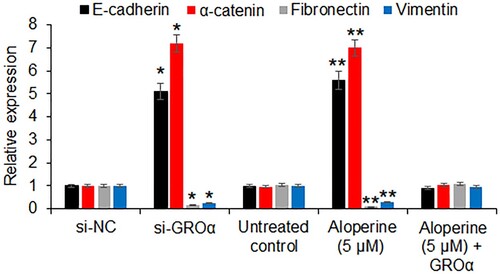
Figure 5. Aloperine inhibits epithelial to mesenchymal transition. The qRT-PCR analysis showing the effect of GROα silencing and aloperine treatment on the expression of E-cadherin, α-catenin, fibronectin and vimentin. The experiments were performed in triplicate and expressed as mean ± SD (*P < .05 for si-NC vs. si-GROα and **P < .05 for untreated control vs. Aloperine (5 µM)).
Data availability statement
That data that supports the findings of this study are available at the figshare repository (https://figshare.com/) at https://figshare.com/s/ca5a26dbbff881374e86