
Figures & data
Figure 1. Lung tissue sections of rats in two groups. The HE staining figures show the model group and control group.
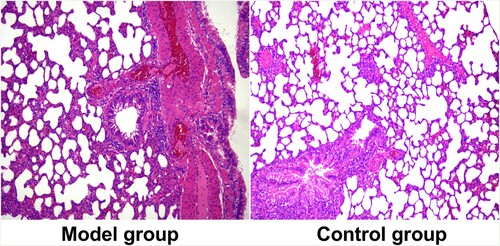
Figure 2. Expression of miR-29c and PTEN in serum and tissue of rats in the model and control groups. A) ELISA method for the comparison of miR-29c in serum; B) RT-qPCR method for comparison of miR-29c in lung tissue; C) ELISA method for the comparison of PTEN in serum; D) RT-qPCR method for comparison of PTEN in lung tissue. * indicates P <0.05, When model group compared with the control group.
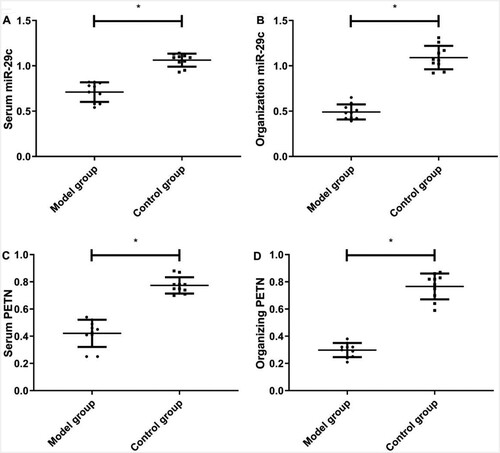
Figure 3. Correlation analysis between miR-29c and PTEN in rats with pneumonia. A) Correlation analysis of miR-29c and PTEN in serum of pneumonia rats; B) Correlation analysis of miR-29c and PTEN in lung tissue of pneumonia rats.
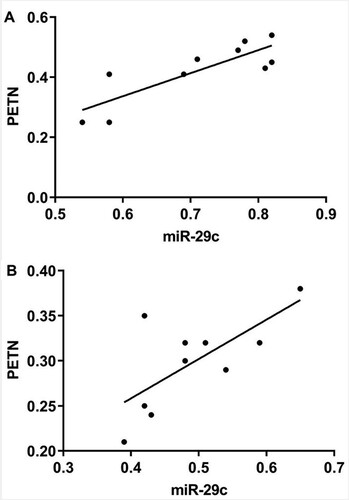
Figure 4. Comparison of apoptosis rate between model and control groups by flow cytometry. * indicates P < 0.05. Flow cytometry method for the column and flow results for apoptosis between model and control groups.
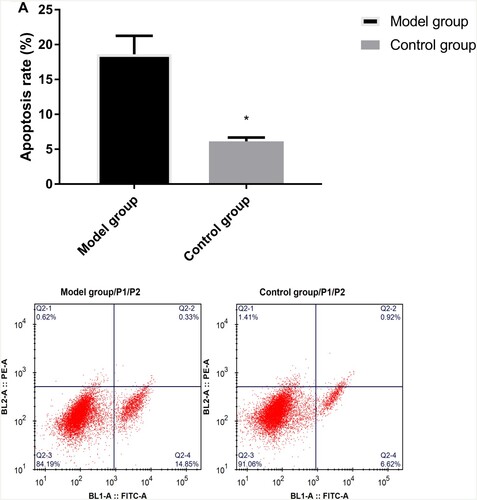
Figure 5. Comparison of protein expression between model and control groups by Western blot. A: Western blot method for column and protein figures for PI3 K expression (ab140307,1:1000) level. B: Western blot method for column and protein figures for Akt (ab38449,1:1000) expression level. C: Western blot method for column and protein figures for NF-kB (ab32536,1:1000) expression level.
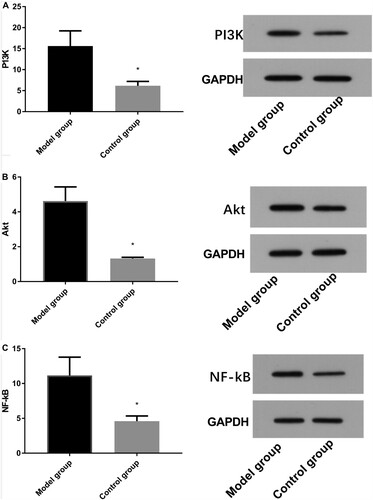
Figure 6. Protein expression after miR-29c transfection by Western blot. A: Western blot method for column figures for PI3 K(ab140307,1:1000), Akt(ab38449,1:1000), and NF-kB(ab32536,1:1000) proteins expression levels. B: The representative graph of protein expression figures for PI3 K, Akt, and NF-kB proteins expression. * indicates P < 0.05 when compared with the miR-29c-mimics group; # indicates P < 0.05 when compared with the miR-29c-inhibitor group.
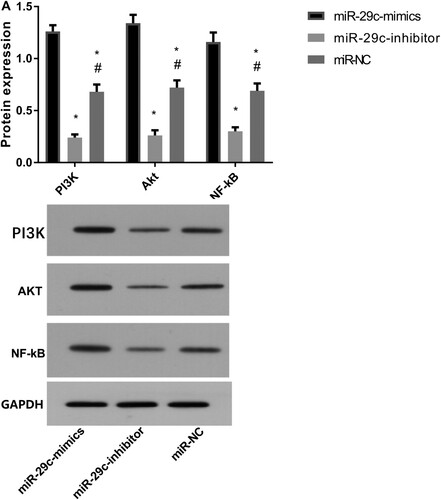
Figure 7. Protein expression after PTEN transfection by Western blot. A) Western blot method for column figures for PI3 K(ab140307,1:1000), Akt(ab38449,1:1000), and NF-kB(ab32536,1:1000) proteins expression. B: The representative graph of protein expression figures for PI3 K, Akt, and NF-kB proteins expression. * indicates P < 0.05 when compared with the sh-PTEN group; # indicates P <0.05 when compared with the si-PTEN group.
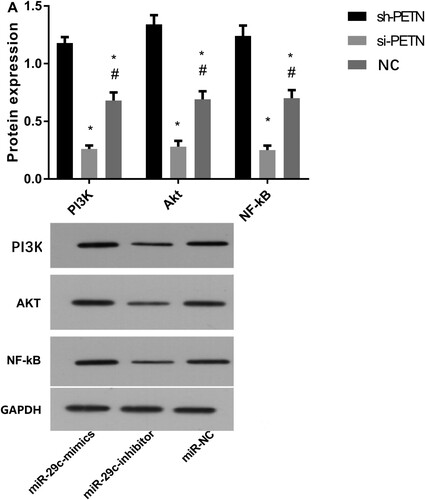
Figure 8. Detection of PI3 K, Akt, and NF-kB mRNA by RT-qPCR. A) Column figures for PI3 K mRNA expression levels; B) Column figures for Akt mRNA expression levels; C) Column figures for NF-kB mRNA expression levels. * indicates P < 0.05, When model group compared with the control group.
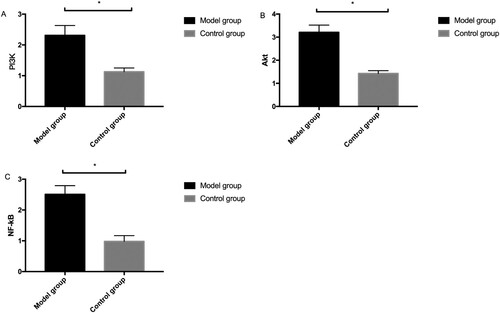
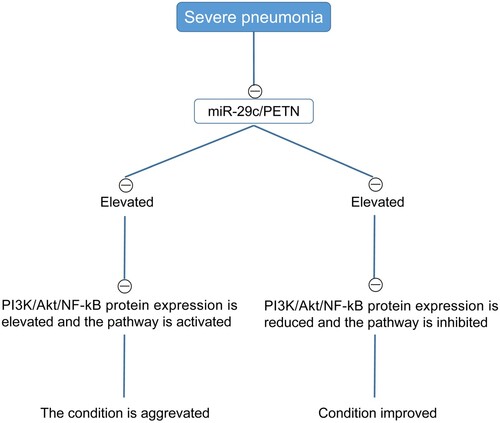
Figure 9. The flow diagram of miR-29c/PTEN affects pneumonia through PI3 K/Akt/NF-kB.
Data availability statement
Due to the nature of this research, participants of this study did not agree for their data to be shared publicly, so supporting data is not available.