
Figures & data
Figure 1. Schematic diagram showing the anatomy of the breast.
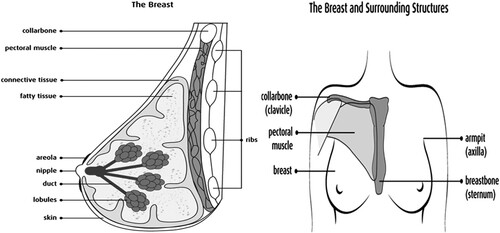
Figure 2. HR subtypes being distinct from the current classification scheme, which is based on ER, PR, and HER2. Reproduced with permission from Santagata et al. Citation2014. Copyright 2014.
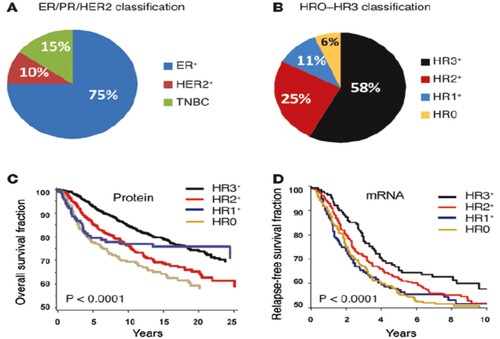
Figure 3. Schematic diagram demonstrating the basic principles of AgNOR method.
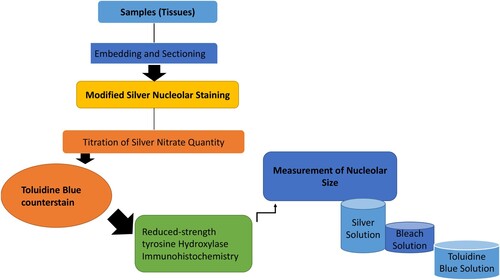
Figure 4. Overall survival and global AgNORs (cutoff 15 m2). Reproduced with permission from Abboud et al. Citation2008. Copyright 2008. Mosby, Inc.
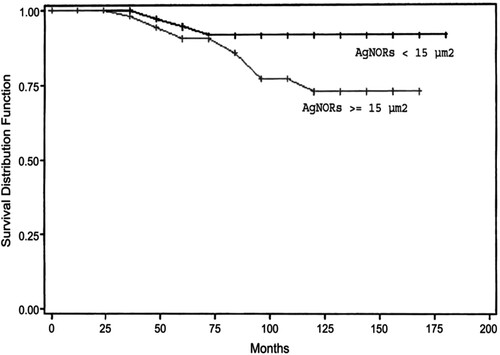
Figure 5. Different cell types stained with AgNOR. Reproduced with permission from Mohanty and Padhy Citation2020, Springer.
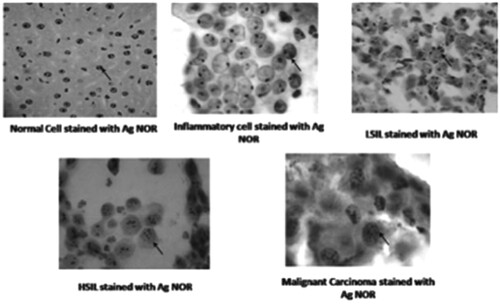
Table 1. Comparison of the grades of tumors with AgNOR count (Khan et al. Citation2006).
Figure 6. Photomicrographs of breast tissues stained with silver nitrate showing AgNOR dots for AgNOR dots for Normal breast tissue with most cells showing single AgNOR dots and Grade 3 IDC with most cells having 5 or more AgNOR dots. (Arrow). (Images were taken under × 40 objective lens with Nikon Eclipse E2000 microscope). Reproduced with permission from Darkwah et al. Citation2018. Copyright 2018. Elsevier.
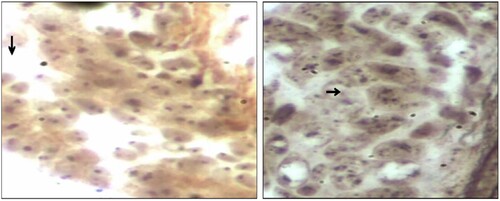
Figure 7. Kaplan-Meier curve of patients with NSCLC with small and large AgNOR areas in MIB-1-positive cells. The X-axis shows the time of life (in days); Y-axis shows the proportion of surviving patients. NSCLC, non-small-cell lung cancer; AgNOR, argyrophilic nucleolar organizer region. Reproduced with permission from Kobylakov et al. Citation2014. Copyright 2014. Cancer Biology & Medicine.
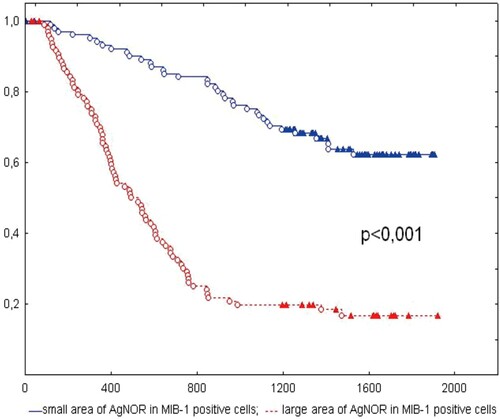
Table 2. Summary of some selected proliferative markers of breast cancer.