
Figures & data
Figure 1. Heptaphylline inhibits pancreatic cancer cell growth. (A) Molecular formula of heptaphylline (B) MTT proliferation assay of PANC1 pancreatic cancer cells administered with 0–160 µM heptaphylline (C) MTT proliferation assay of H6c7 normal pancreatic ductal cells administered with 0–160 µM heptaphylline (D) clonogenic assay of PANC1 pancreatic cancer cells administered with 0, 6, 12 µM or 18 µM heptaphylline. Experiments were performed independently in triplicates and data presented as mean ± SD (*P < .05).
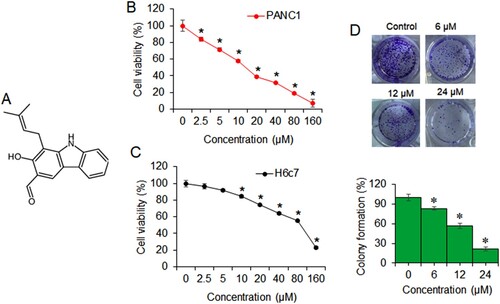
Table 1. IC50 of Heptaphylline against different human pancreatic cancer cell lines and normal pancreatic cells as determined by MTT assay
Figure 2. Heptaphylline decreases migration, invasion and EMT of pancreatic cancer cells. (A) Transwell invasion assay of PANC1 pancreatic cancer cells administered with 0, 6, 12 or 18 µM heptaphylline (B) transwell migration assay of PANC1 pancreatic cancer cells administered with 0, 6, 12 µM or 18 µM heptaphylline (C) expression analysis of epithelial (E-cadherin) and mesenchymal (N-cadherin and vimentin) marker proteins from PANC1 pancreatic cancer cells administered with 0, 6, 12 or 18 µM heptaphylline. Experiments were performed independently in triplicates and data presented as mean ± SD (*P < .05).
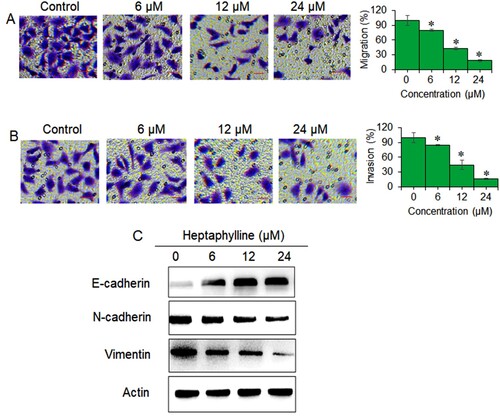
Figure 3. Heptaphylline induces apoptosis in pancreatic cancer cells. (A) DAPI staining of PANC1 pancreatic cancer cells administered with 0, 6, 12 µM or 18 µM heptaphylline (B) flow cytometric analysis of PANC1 pancreatic cancer cells administered with 0, 6, 12 or 18 µM heptaphylline (C) expression analysis of apoptosis marker proteins from PANC1 pancreatic cancer cells administered with 0, 6, 12 µM or 18 µM heptaphylline. Experiments were performed independently in triplicates.
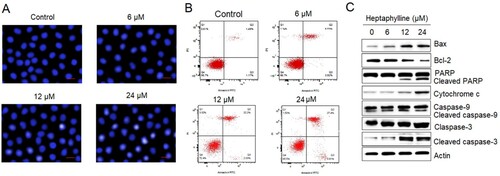
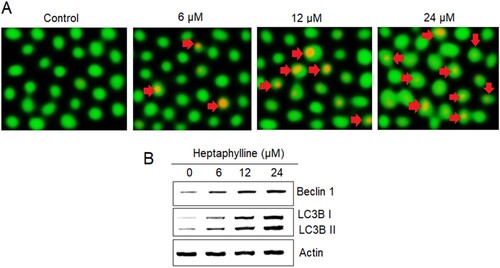
Figure 4. Heptaphylline induces autophagy in pancreatic cancer cells. (A) AO staining analysis of PANC1 pancreatic cancer cells administered with 0, 6, 12 or 18 µM heptaphylline (Arrows depict autophagic vesicles) (B) expression analysis of autophagy marker proteins from PANC1 pancreatic cancer cells administered with 0, 6, 12 or 18 µM heptaphylline. Experiments were performed independently in triplicates.
Data availability statement
That data which supports the findings of the present study are available at the figshare repository (https://figshare.com/) at https://figshare.com/s/00d5684af02f6e56e993.