
Figures & data
Table 1. Features of six Lupinus species with L. westianus as the reference.
Figure 1. Analysis of simple sequence repeats (SSRs) in the chloroplast genome of six Lupinus species. (a) The types and numbers of SSRs identified in six Lupinus species; (b) The frequency of SSRs motifs in six Lupinus species.
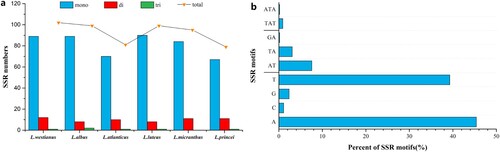
Figure 2. Analysis of repeat types and numbers in six Lupinus speices.
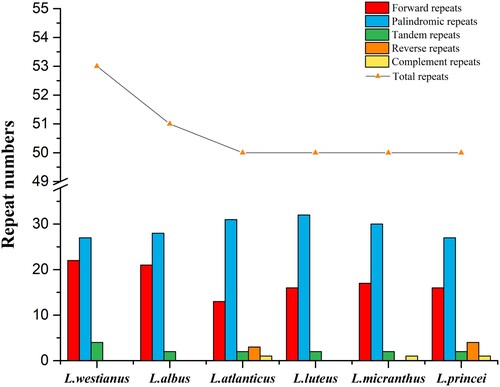
Figure 3. Comparisons of borders between neighboring genes and junctions of the LSC, SSC and IR regions among the six Lupinus species. Boxes above or below the main line indicate genes adjacent to borders. The figure is not to scale with regard to sequence length and shows only relative changes at or near (inverted repeats/single copy) IR/SC borders. Number above the gene features means the distance between the ends of genes and the borders sites.
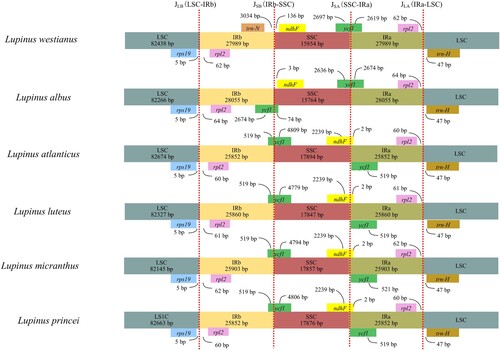
Figure 4. Comparison of chloroplast genome sequences of six Lupinus species. The outer ring show the coding sequences, tRNA genes, rRNA genes and other genes in the forward and reverse strands. The next six rings show the blast results between the chloroplast genomes of L. westianus and other 5 Old World Lupinus species based on BlastN. The following ring is GC skew curve for the L. westianus chloroplast genome. GC skew+ (green) indicates G > C, GC skew − (purple) indicates G < C. The innermost black ring is the GC content curve for the L. westianus chloroplast genome.
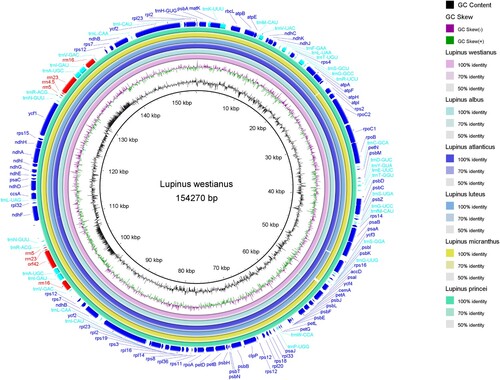
Figure 5. Genomic rearrangement of six Lupinus species. The blue frame represents a 20kb inversion region (ndhF-ycf1).
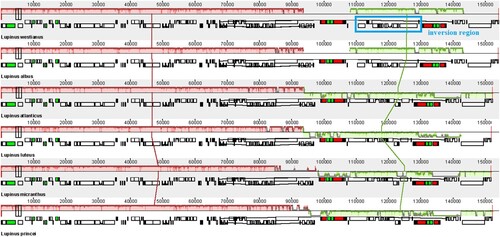
Figure 6. Comparative analysis of nucleotide variability (Pi) values among the chloroplast genome sequences of six Lupinus species.(a) Analysis of the homologous protein-coding genes; (b) Analysis of the intron regions; (c) Analysis of the IGS regions.
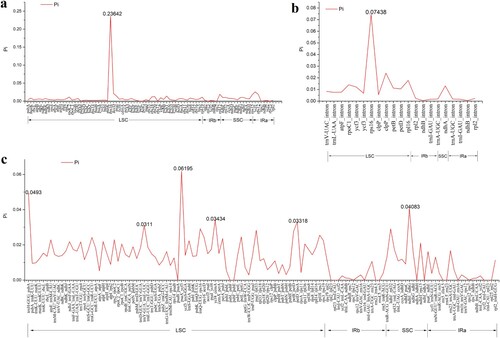
Figure 7. The Ka/Ks ratios of homologous protein-coding genes in six Lupinus species, with L. westianus as the reference.
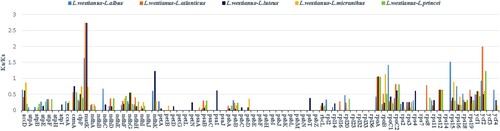
Table 2. Parameter estimates and log-likelihood values for different models in selectivepressure analysis.
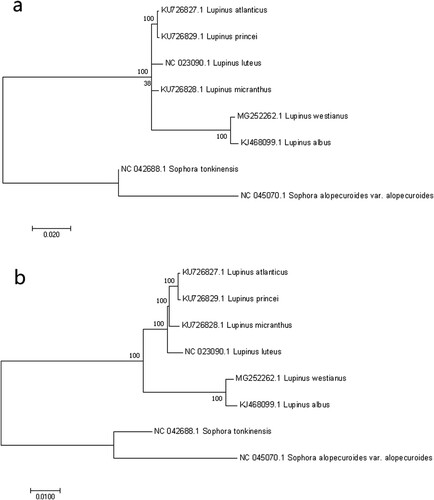
Figure 8. Phylogenetic relationships based on the chloroplast genomes of six Lupinus species and two Sophera species with the ML and NJ method. (a) ML tree; (b) NJ tree. Sophera species was selected as the outgroup. Numbers on the left side at the branches represent bootstrap values.
Supplemental Material
Download PDF (154.5 KB)Data availability statement
The data that support the findings of this study are openly available in National Center of Biotechnology Information at https://www.ncbi.nlm.nih.gov/, accession number are MG252262, KJ468099, KU726827, NC023090, KU726828, KU726829, NC045070, NC0-42688.