Figures & data
Table 1. DNA barcoding primers and their sequences.
Table 2. The studied taxa of genus Acacia and their Accession numbers in GenBank.
Figure 1 DNA profile of 24 taxa of genus Acacia generated by rbcl and matk primers.
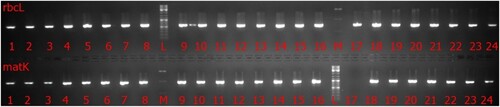
Table 3. Statistics derived from the sequencing, alignment and BLAST processes.
Table 4 Mean nucleotide substitution rates and transition/transversion bias (R) in loci for 24 taxa of Acacia calculated by Maximum Likelihood Method.
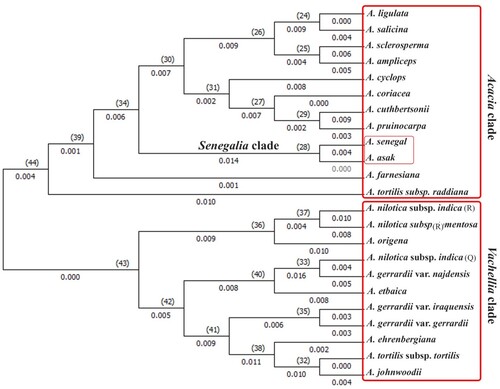
Figure 2 Phylogeny tree of 24 taxa of Acacia based on rbcL locus using Maximum Likelihood Tree Method.
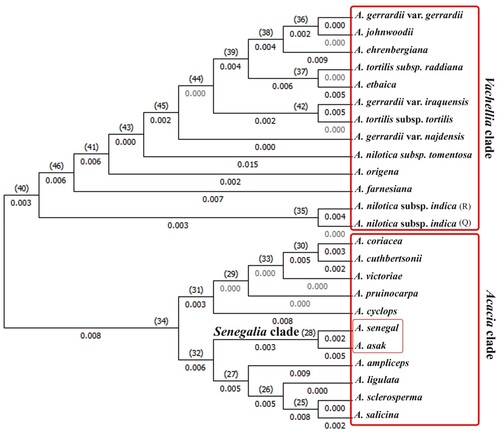
Figure 3 Phylogeny tree of 24 taxa of Acacia based on matK locus using Maximum Likelihood Tree Method.