
Figures & data
Figure 1. High level of TRIM52 expression predicts poor prognosis. (A) KM-plot database was used for multivariate analysis of the survival of patients with OC. (B) Hscore of tissues. (C) The expression level of TRIM52 was measured in normal and OC tissues by IHC staining. (100 µm scale bar).
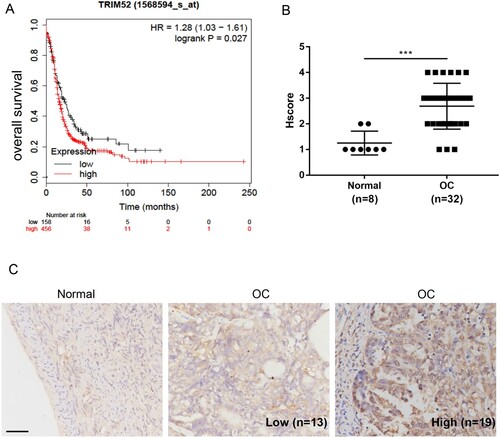
Table 1. Correlation between the TRIM52 expression and clinicopathological characteristics in 32 patients with HGSOC.
Figure 2. TRIM52 knockdown inhibits cell proliferation and induces apoptosis. (A) TRIM52 expression was detected in the OC cell and ovarian epithelial cell lines. *P < 0.05, **P < 0.01, ***P < 0.001 vs. HO8910. #P < 0.05, ##P < 0.01, ###P < 0.001 vs. IOSE80. (B) qRT-PCR and Western blot were used to evaluate TRIM52 knockdown efficiency. (C) Cell proliferation was measured by the CCK-8 assay. (D) Cell apoptosis was measured by the Annexin-V/ PI assay. (E) Statistic analysis results of cell apoptosis in the different groups. ***P < 0.001 vs. shNC.
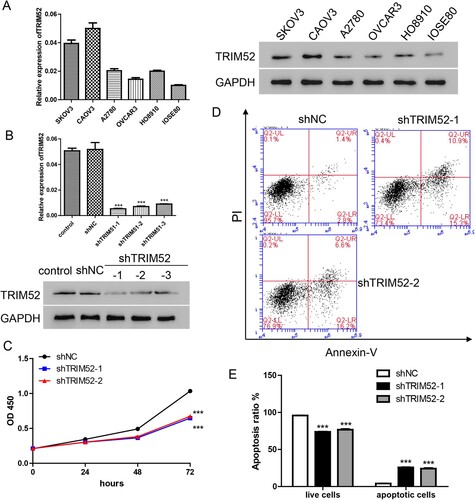
Figure 3. TRIM52 knockdown inhibits tumor growth in vivo. (A) Images of the CAOV3-derived xenograft tumors at the end of study. (B) Tumor growth curves of the CAOV3-derived mouse xenografts. (C) Representative images of H&E staining of the CAOV3-derived tumor sections (magnification ×200). (D) Representative images of TUNEL staining of the tumor sections (magnification ×200). (E) Western blot was used to quantify the protein levels of TRIM52, GLUT1, PKM2, p-STAT3, and STAT3. *P < 0.05 vs. shNC.
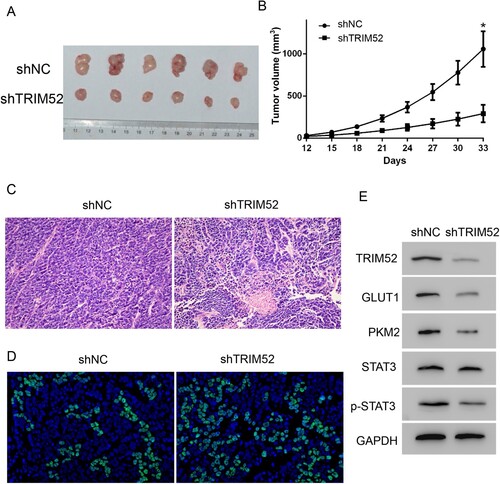
Figure 4. TRIM52 knockdown depresses glucose metabolism in CAOV3 cells. (A) Glucose uptake was analyzed by measuring the level of 2-NBDG. (B–C) Lactate and ATP production were measured after treatment with shTRIM52 lentivirus. (D) Western blot was used to quantify the protein levels of TRIM52, GLUT1, PKM2, p-STAT3, and STAT3.
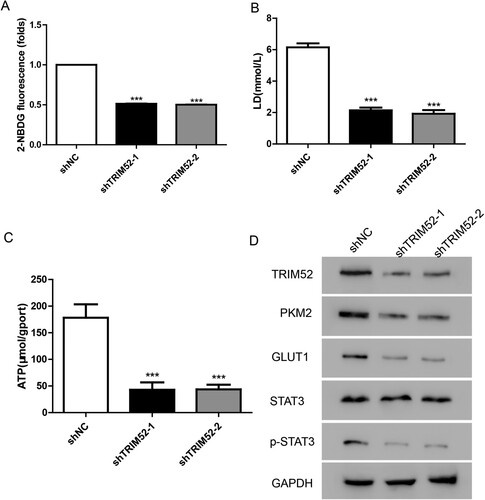
Figure 5. AG490 abolishes the increased cell growth induced by TRIM52. (A) qRT-PCR and Western blot were used to evaluate the level of TRIM52 in the OVCAR3 cells. (B) Cell proliferation was measured by the CCK-8 assay. (C) Cell apoptosis was measured by the Annexin-V/PI assay. (D) Statistic analysis results of cell apoptosis in the different groups. ***P < 0.001 vs. vector, ###P < 0.001 vs. TRIM52 + AG490.
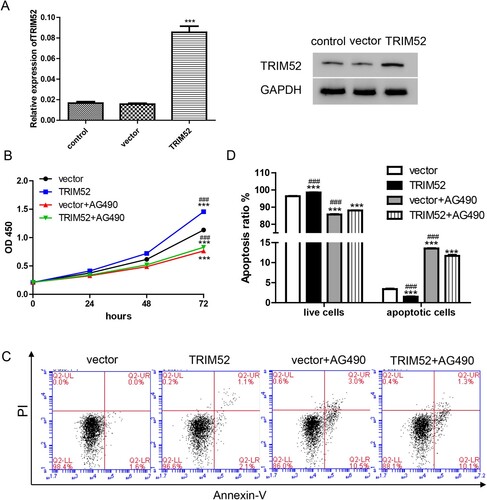
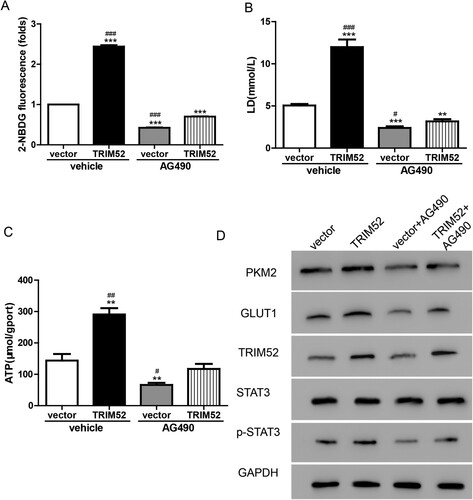
Figure 6. AG490 plays a role opposite to that of TRIM52 in regulating glucose metabolism in OVCAR3 cells. (A) Glucose uptake was analyzed by measuring the level of 2-NBDG. (B–C) Lactate and ATP production were measured. (D) Western blot was used to quantify the protein levels of TRIM52, GLUT1, PKM2, p-STAT3, and STAT3. **P < 0.01 vs. vector, ***P < 0.001 vs. vector, #P < 0.05 vs. TRIM52+AG490, ##P < 0.01 vs. TRIM52+AG490, ###P < 0.001 vs. TRIM52 + AG490.
Data availability statement
The data that support the findings of this study are available in ‘figshare’ [https://figshare.com/] at
http://doi.org/10.6084/m9.figshare.14702145
http://doi.org/10.6084/m9.figshare.14702148
http://doi.org/10.6084/m9.figshare.14702160
http://doi.org/10.6084/m9.figshare.14702169
http://doi.org/10.6084/m9.figshare.14702175