
Figures & data
Figure 1. Chemical structure of 19D. (a) Chemical structure of 19D molecule. (b) LC-MS spectrum. Peak close to 499.4 m/z value indicates 19D molecule.
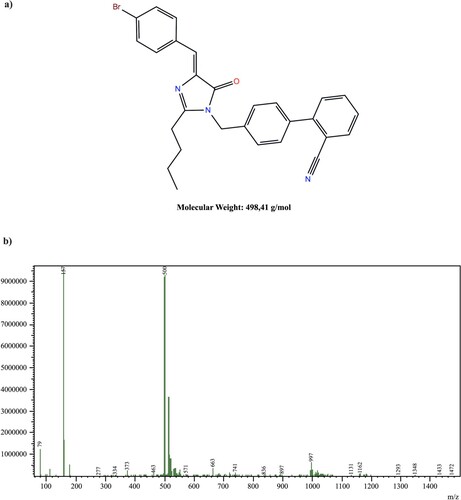
Figure 2. Cell cycle analysis of HCT, HUVEC and U-87 MG cells after 48 h of treatment with 19D and Paclitaxel. (a) Cell cycle histograms of U-87 MG cells after treatment with DMSO (control), 5, 10, 25, 50 and 100 µM 19D. (b) Cell cycle stage distributions of HCT, HUVEC and U-87 MG after treatment with 25, 50 and 100 µM concentration of 19D molecule compared with Paclitaxel and DMSO (control) All studies were triplicated.
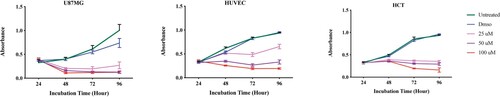
Figure 3. Viability and proliferation of 19D-treated and control cells. Cells were treated by DMSO (control), 25, 50 and 100 µM 19D molecule and MTT assay was performed to determine cell viability. Cells were monitored for 4 days and cell viability was measured at 24, 48, 72 and 96 h.
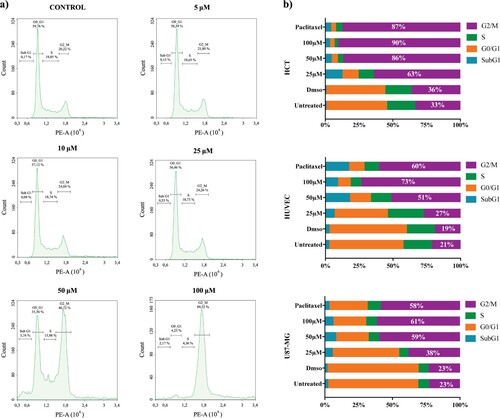
Figure 4. Microscopic evaluation of 19D-treated and control cells (a) Phase-contrast images of HUVEC, HCT and U-87 MG treated with DMSO (control) and 100 µM concentration of 19D. (b) 100× image of 100 µM 19D-treated cells showing membrane blebbing and apoptotic body formation. (c) Hematoxylin and Eosin staining of DMSO (control), 100 µM 19D and 100 nM Paclitaxel-treated cells at 24 h. (d) Immunofluorescence staining with beta-tubulin, Lamin B1 and DAPI of DMSO (control),100 µM 19D and 100 nM Paclitaxel-treated HUVEC cells at 24 h.
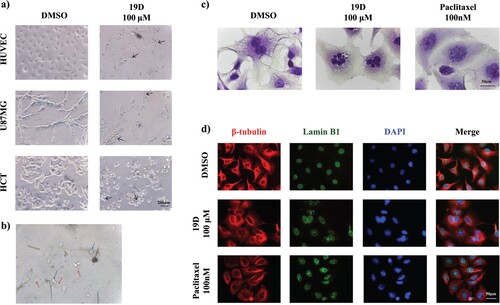
Figure 5. Caspase activation and CDC2 inhibition in 19D treated and control cells. (a) Caspase-3/7 activation shown by light microscopy and live cell staining by four short peptide-based fluorogenic substrate DEVD of HUVEC cells treated with DMSO (control), 25, 50 and 100 µM 19D and staurosporine as a positive control. (b) Western blot image of HUVEC cells treated with DMSO, 19D, Paclitaxel and staurosporine showing Caspase-3 expression relative to actin expression. (c) Western blot image of HUVEC cells treated with DMSO, 19D and Paclitaxel showing CDC2 expression relative to actin expression. (d) Relative CDC2 expression percentage level according to western blot bands.
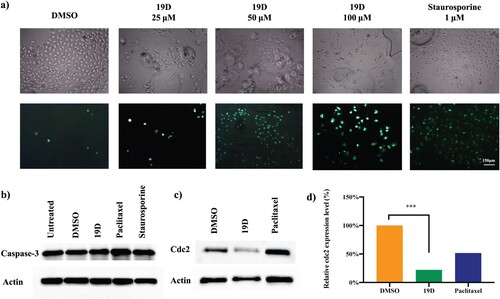
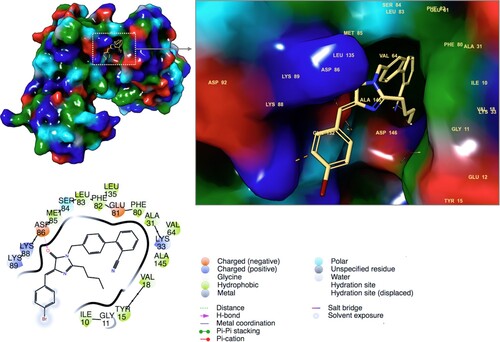
Figure 6. 2D and 3D ligand interactions diagram of 19D at the binding pocket of CDC2 (CDK1).
Data Availability
All necessary experimental raw data including cell proliferation assays, cell cycle inhibition assays, cell images and western blot assays were uploaded to Zenodo Database via link below: https://doi.org/10.5281/zenodo.4748912