
Figures & data
Figure 1. Preoperative MRI T1 with contrast, CTA, and ophthalmic examination. Enhanced Axial (A, B), sagittal (C), and coronal (D) MRI showed a sellar pituitary mass with sphenoidal extension and invasion. The right ICA was compressed and shifted posteriorly. The optic chiasm was not affected. 3D reconstruction (E), coronal (F), coronal with and without (G) contrast showed that the main portion of the tumor (*) was located in the sphenoidal sinus. The right ICA and the optic canal were involved (H). (I, J) The test revealed a severe visual field defect on the right side and a slight defect on the left side. (K) The patient presented a symptom with CN III palsy.
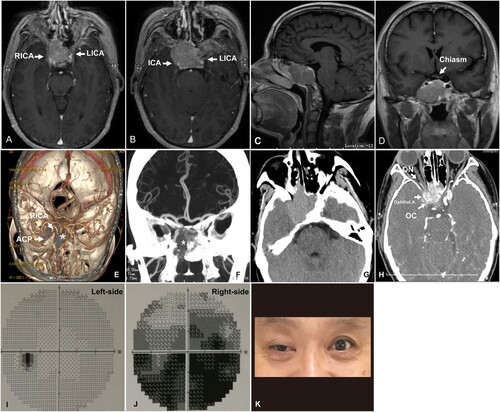
Figure 2. Intraoperative snapshot and histological tumor specimens. (A, B) exhibited the tumor (*) was soft and with abundant blood supply. (C, D) Post-operative MRI indicated the mass effect of the tumor was resolved and the right ICA was returned to normal locality. (E) Hematoxylin and eosin staining of the pituitary tumor demonstrating a tumor without pituitary tissues. Immunohistochemical expression of (F) hepatocytes, (G) ki67, and (H) CK18. Bar: 60 μm.
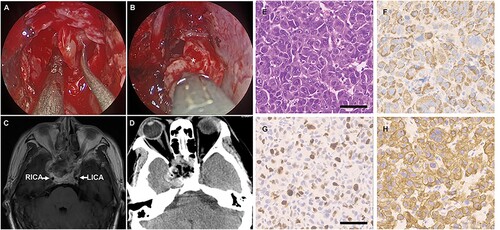
Figure 3. Post-operative PET-CT scan. PET-CT showed high radioactive uptake in the right and anterior abdominal wall (A), liver lobe (B, C), colonic wall (D), and active lesions in the sphenoid sinus (E).
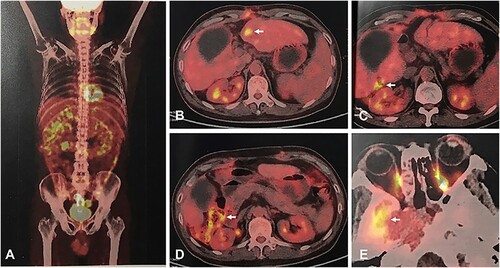
Table 1. Pooled analysis of HCC-derived PM.
Data availability statement
The data and materials supporting this study are available, without breaching participant confidentiality, in the Harvard Dataverse Repository [https://dataverse.harvard.edu/] at https://doi.org/10.7910/DVN/PWXGFD.