
Figures & data
Figure 1. Schematic workflow in this study. This report aimed to identify the potential targets through integrating GO biological process, KEGG pathway analyses and network construction.
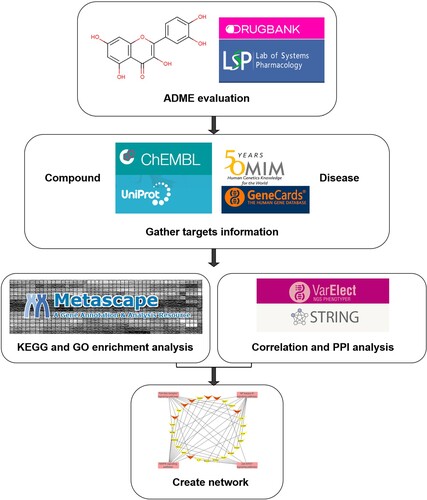
Table 1. Pharmacological properties of quercetin.
Figure 2. (a) PPI network of the potential therapeutic targets of quercetin against SI. The area of nodes indicates the degree of the target in the network. The warmer of the target color, the higher of the degree; (b) PPI network of the therapeutic hub targets of quercetin against SI. The more reddish of the target, the higher of the degree. The network networks were constructed by Cytoscape 3.7.1.
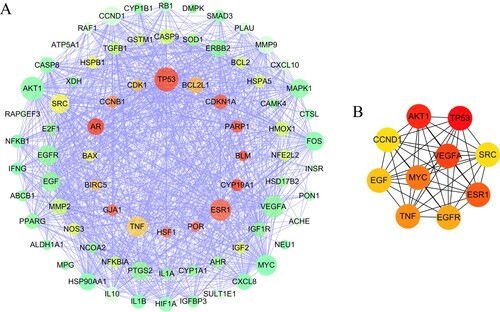
Figure 3. GO biological process analysis of the therapeutic targets of quercetin against SI. The y-axis shows significantly enriched biological processes, the x-axis shows the p-value of categories.
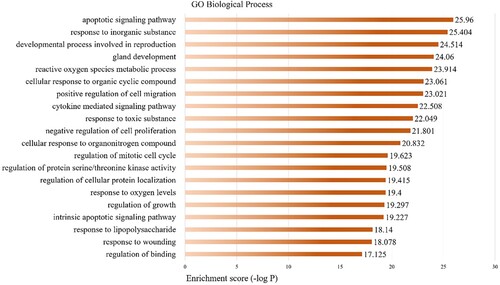
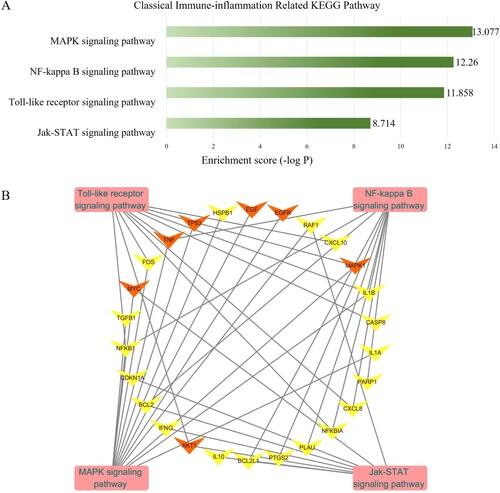
Figure 4. (a) Annotation of classical inflammation KEGG pathway of the targets of quercetin against SI. The y-axis shows significantly enriched pathways categories of the therapeutic target, the x-axis shows the p-value. (b) Therapeutic target-inflammation-related pathways network. The arrows are targets, squares are inflammation-related KEGG pathways. The orange arrows are hub therapeutic targets. The network networks were constructed by Cytoscape 3.7.1.
Data availability
Data sharing is not applicable to this article as no new data were created or analyzed in this study.