
Figures & data
Figure 1. Proliferation of FZXJP-treated HT-29 cells and SW620 cells using the CCK-8 assay. HT29 cells and SW620 cells were treated with 0.5, 1, 2, 4, 8, and 16 mg mL−1 FZXJP; FZXJP, FuZheng XiaoJi Decoction; **P < 0.01, compared with 0 mg mL−1.
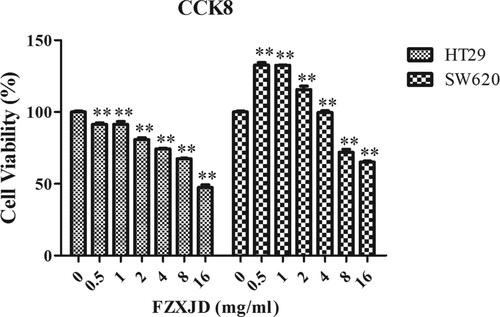
Figure 2. Results of differential expression analysis. (A) the heatmap of DEGs; horizontal axis represents six samples, vertical axis represents genes; (B) the volcano plot of DEG.
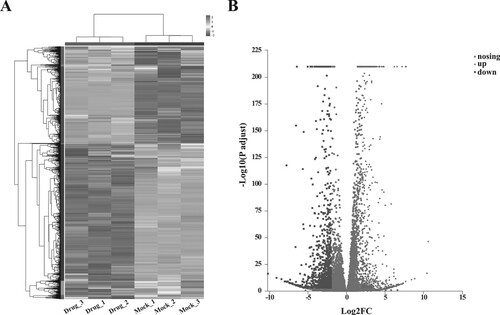
Figure 3. Results of functional enrichment analysis. (A) The top 20 GO function terms for DEGs. BP, biological process; CC, cellular component; MF, molecular function; (B) KEGG pathways for DEGs; M, metabolize; OS, organisms system; EIP, environmental information processing. Vertical axis represents the enriched GO terms and KEGG pathways, respectively; horizontal axis represents the significant value; the smaller PDR represent more significant value of the GO terms and KEGG pathways.
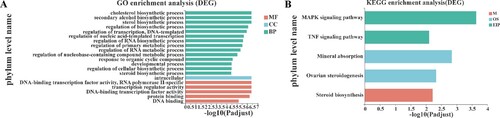
Figure 4. Protein-protein interaction network. Light gray nodes represent up-regulated genes, and dark gray nodes represent down-regulated genes; node size represents the degree of each node.
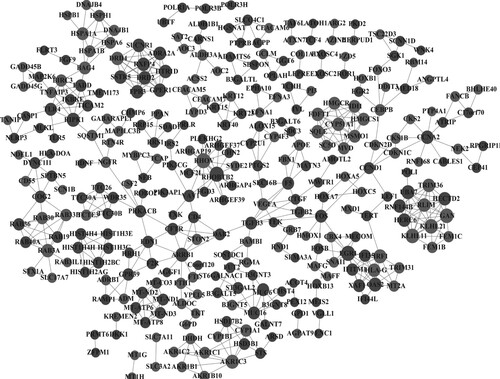
Table 1. The 61 genes with degree > 5 in the PPI network.
Figure 5. The regulatory network. (A) The miRNA-gene regulatory network; (B) The transcription factor-gene regulatory network; (C) The miRNA-gene-transcription factor regulatory network. Light grey nodes represent up-regulated genes, and dark grey nodes represent down-regulated genes; rhombus represents transcription factors; hexagon represents miRNAs.
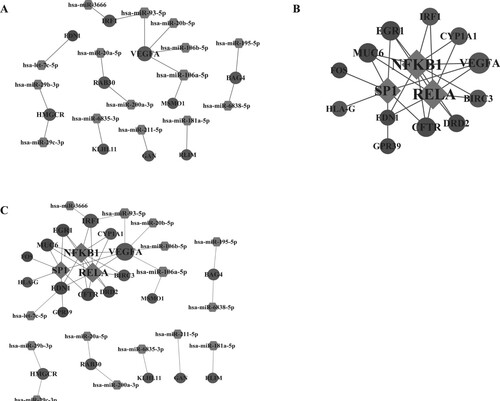
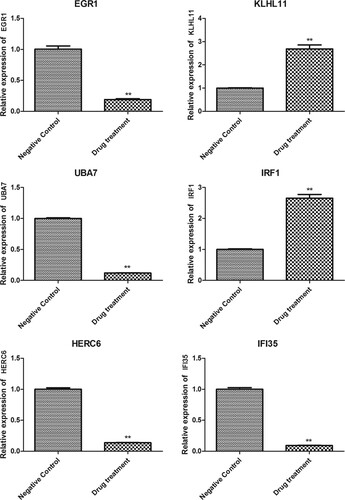
Figure 6. The expression of DEGs determined by RT-qPCR. The expression of EGR1, KLHL11, UBA7, IRF1, HERC6, and IFI35 in HT-29 cells (negative control) and FZXJP-treated HT-29 cells (drug treatment). **P < 0.01, compared with negative control.
Supplemental Material
Download Zip (1.2 MB)Data availability statement
The data that support the findings of this study are available in NCBI BioProject repository [https://www.ncbi.nlm.nih.gov/bioproject/PRJNA746620] with accession number PRJNA746620.