
Figures & data
Figure 1. Findings of agarose gel electrophoresis of MTHFR CT SNP in the studied rabbits, marker (100 bp). Figure A: lanes 1, 2 homozygous for C (198 bp), lanes 3→10 heterozygous CT (198, 175 bp) and lanes 11→15 homozygous for T (175 bp). Figure B: lanes 1→4 homozygous for C (198 bp), lanes 5→8 heterozygous CT (198, 175 bp) and Lanes 9, 10 homozygous for T (175 bp). Figure C: lanes 1→5 homozygous for C (198 bp), lanes 6, 7 heterozygous CT (198, 175 bp) and lanes 8→10 homozygous for T (175 bp).
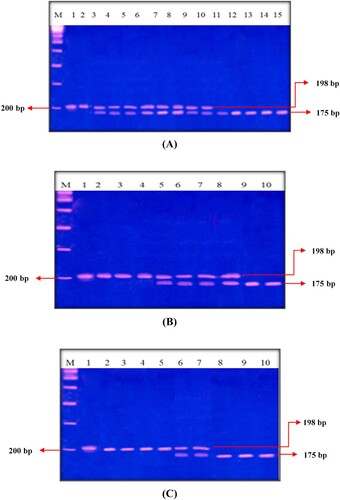
Figure 2. Allele and genotype frequencies for MTHFR C677T polymorphism in G1, G2, G3, and all groups (X2 and p-value).
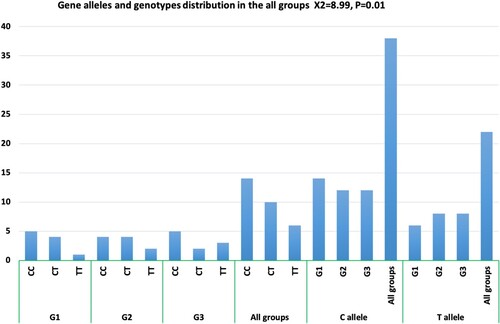
Table 1. Allele and genotype frequencies for MTHFR C677T polymorphism in all groups.
Table 2. Comparison of laboratory data of all groups (mean ± SD, ANOVA; (F) test and t-test).
Table 3. Comparison of laboratory data (mean ± SD, ANOVA; (F) test and t-test) with different MTHFR C677T genotypes in all groups (n = 30).
Table 4. Comparison of laboratory data (mean ± SD, ANOVA; (F) test and t-test) with different MTHFR C677T genotypes in G2 and G3 (n = 20).
Figure 3. Photomicrographs from the testes of rabbits that were stained with HE. A section from G1 in Figure A shows two seminiferous tubules (ST) lined by spermatogenic and Sertoli cells (SE). Spermatogonia (SG) and Sertoli cells (SE) rest on a thin basement membrane (BM) that is surrounded by flat myoid cells (M). Several layers of primary spermatocytes (PS), spermatids (SM) and sperms (SP) are observed. Multiple interstitial Leydig cells (L) with vesicular nuclei and acidophilic cytoplasm appear between the ST, while Figure B of G2 shows two irregular ST lined with few spermatogenic cells as SG and PS with numerous SE. Also, the lumen of ST has some SP and multiple sloughed spermatogenic cells (SL) that have dark condensed nuclei. Additionally, Figure C of G3 shows numerous SG and SE resting on the BM followed by multiple layers of PS and SP similar to those of G1. Multiple L cells appear around a small blood vessel (BV) between the ST. HE × 1000 and the bar = 50 μm.
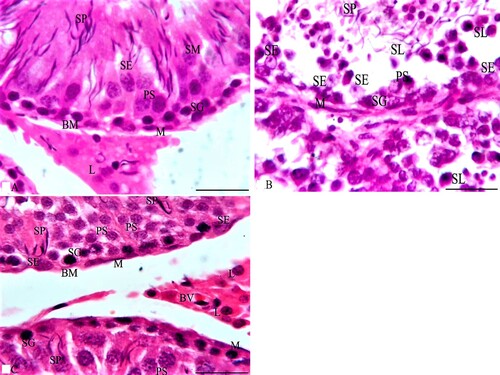
Figure 4. Photomicrographs from the testes of rabbits that were stained with MT. A section from G1 in Figure A shows boundaries between two ST that are surrounded by a thin BM and separated by a thin interstitial tissue of loose connective tissue (LCT). Each ST is lined by several layers of spermatogenic cells as SG, PS and SP with SE cells that rest on the BM. Multiple L cells appear around a small blood vessel (BV) in LCT between the ST. Additionally, sections of G2 as in Figure B reveal that ST are surrounded by a thick BM and separated by a thick, wide LCT of collagen fibres with multiple L cells around a small congested BV and the ST are lined with spermatogenic cells as SG and PS. Also, their lumen has multiple SL. A section from G3 in Figure C reveals boundaries of three ST that are surrounded by a thin BM and separated by a thin LCT with multiple L cells between the ST while each ST is lined by several layers of spermatogenic cells as SG that rest on the BM, PS and SP similar to those of G1. MT × 1000 and the bar = 50 μm.
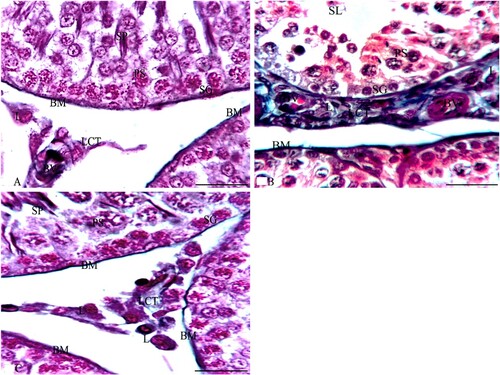
Figure 5. Photomicrographs from rabbit testes that were stained with PAS stain. A section from G1 in Figure A shows the boundaries of three ST that are surrounded by a thin BM and separated by a thin interstitium of LCT. Each ST is lined by several layers of spermatogenic cells, such as SG, PS, and SP with SE cells that rest on the BM. Multiple L cells appear in LCT between the ST. Additionally, sections of G2, as in Figure B, reveal three irregular ST that are surrounded by a thick BM and irregular flat myoid cells (M) and that are separated by a thick, wide LCT with multiple L cells. Meanwhile, the ST are lined with SE and spermatogenic cells such as SG and PS while their lumen has few SP. Furthermore, a section from G3 in Figure C reveals the boundaries of three ST that are surrounded by a thin BM and separated by a thin LCT with multiple L cells between the ST. Meanwhile, each ST is lined by SE and several layers of spermatogenic cells as SG that rest on the BM, PS, and SP that are very similar to those of G1. PAS × 1000 and the bar = 50 μm.
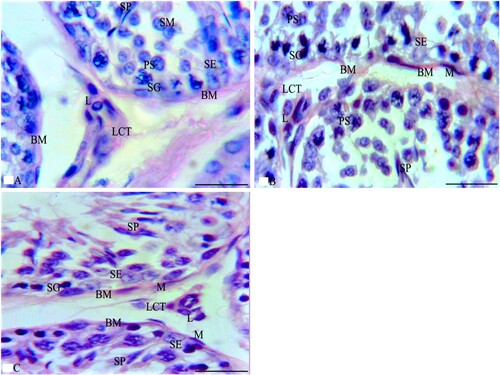
Figure 6. Photomicrographs from rabbit testes that were immunostained by TUNEL assay. A section from G1 in Figure A shows the boundaries of two ST that are separated by a thin LCT with multiple L cells between the ST. The ST rest on the BM and are lined by SE and spermatogenic cells, such as SG, PS, and SP that do not reveal apoptosis. Additionally, a section from G2 in Figure B shows the boundaries of two adjacent ST that are separated by a few L cells between the ST. The ST are lined by spermatogenic cells, such as SG (that rest on BM with M cells) and PS that reveal multiple apoptotic cells (AP). Meanwhile, the section of G3 in Figure C reveals the boundaries of four ST that are separated by a thin LCT. The ST rest on BM and are lined by spermatogenic cells such as SG, PS, and SP that reveal few AP cells. TUNEL assay × 1000 and the bar = 50 μm.
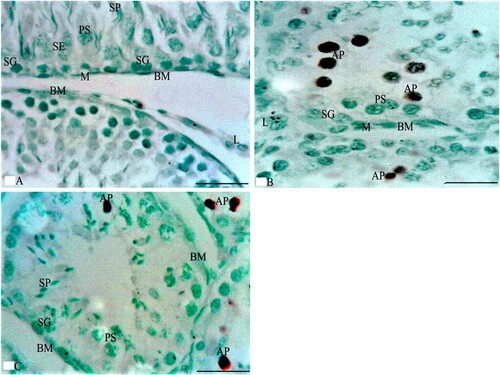
Table 5. Statistical analysis of the morphometrical study of the testes of all groups (size of ST, area % of collagen fibres, and percentage of apoptotic cells in the spermatogenic and Sertoli cells of ST).
Data availability statement
Sharing the data is restricted by the funder of this study, so supporting data is not available.