
Figures & data
Figure 1. Characterization of fetal liver cell-derived exosomes (FLC-EXOs). Exosomes were isolated by ultracentrifugation combined with ultrafiltration. After isolation, FLC-EXOs were observed using TEM. The isolated vesicles had a cup-like shape (a). After ultracentrifugation, the pellets of FLC-EXOs were dissolved in 500 µL PBS, and then the distribution of particle diameter and concentration of FLC-EXOs were analyzed using the nanoparticle tracking analysis system of qNano (Izon, Christchurch, New Zealand) (b), and 550 particles were analyzed to make the data statistically representative (c). To further confirm the identity of FLC-EXOs, 5 µg of FLC-EXOs were loaded in each lane and probed with exosome-specific antibodies against CD81, HSP70, CD63, and CD9. Number 1–4 represents four samples of exosomes that isolated in parallel (d).
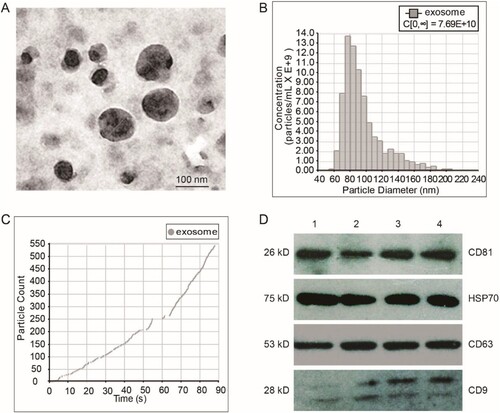
Figure 2. FLC-EXOs and BV2 microglia showed colocalization. To determine whether FLC-EXOs were colocalized with microglia, after ultracentrifugation, exosomes were dissolved in a diluent solution and labeled with the red fluorescent membrane dye, PKH26. After filtering through a 0.2 µm filter, PKH26-labeled FLC-EXOs were incubated with BV2 microglia and observed at 2 h (a–c), and 4 h (d–f), and 6 h (g–i) using a living cell imaging system after incubation. To avoid dye aggregates, the PKH26-only group was treated with the same exosome group and used as the control (j–l).
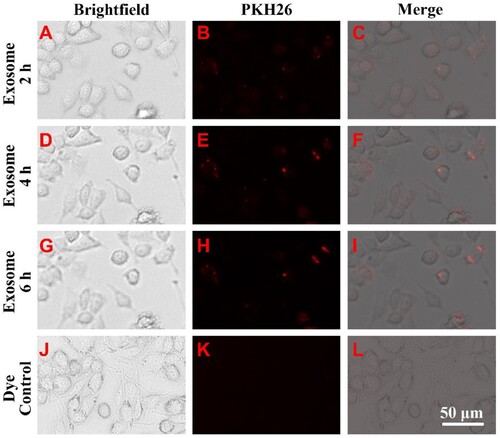
Figure 3. Administration of FLC-EXOs decreased the expression of pro-inflammatory cytokines in BV2 microglia. BV microglia were seeded in a 96-well plate overnight, 5 × 10⁴ per well. Then BV2 cells were treated with 5 µg of FLC-EXOs/well. After treatment for 4 h with FLC-EXOs, BV2 microglia were treated with LPS at a concentration of 100 ng/mL for 2 h. The culture media were collected the expression levels of TNF-α and IL-1β were analyzed using ELISA. It showed that administration of FLC-EXOs decreased the levels of TNF-α and IL-1β compared with the group that treated with LPS only or treated with MEF exosomes (MEF-EXO). The group that without any treatment or that treated with LPS only was labeled with CK and LPS respectively in the figure. The group that first treated with LPS and then with exosomes was labeled with LPS/EXO (a, b). Then, the BV2 cells were treated with FLC-EXOs at concentrations of 0, 5, 10, and 20 µg/well in the same way. The expression levels of TNF-α and IL-1β were measured using ELISA. The results indicated that all treatment with different concentrations decreased TNF-α and IL-1β expression and the decrease was dose-dependent (c, d). (Data are means ± standard deviation of 3 replicates. *P < .05, **P < .01, *** P < .001)
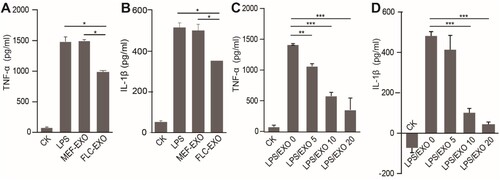
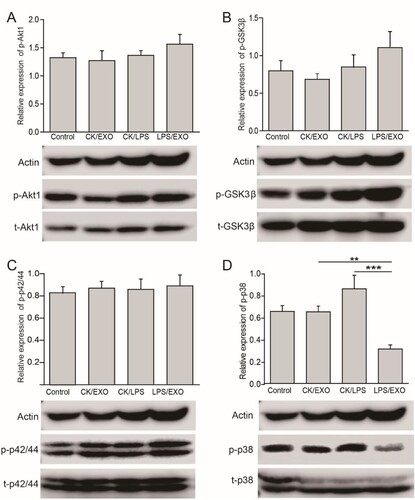
Figure 4. Administration of FLC-EXOs inhibited the activation of p38/MAPK and slightly enhanced GSK3β pathway in BV2 microglia. BV2 cells were treated with 5 µg of FLC-EXOs for 4 h, and then treated with LPS at a concentration of 100 ng/mL for 2 h. Cell lysates were prepared and subjected to WB analysis with antibodies against phosphorylated Akt1 (p-Akt1), total Akt1 (t-Akt1), phosphorylated GSK3β (p-GSK3β), total GSK3β (t-GSK3β), phosphorylated p42/44(p-p42/44), total p42/44 (t-p42/44), phosphorylated p38 (p-p38), and total p38 (t-p38) (a). The ratios of p-Akt1 to t-Akt1, p-GSK3β to t-GSK3β, p-p42/44 to p42/44, and p-p38 to p38 were determined by densitometry analysis. Administration of FLC-EXOs did not affect the Akt1 and p42/44 MAPK signaling pathways (a, b), slightly activated the GSK3β pathway (c), and inhibited the activation of the p38 pathway (d). (Data are means ± standard deviation of 3 replicates.**P < .01)
Data availability statement
The data that support the findings of this study are available in “figshare” at https://doi.org/10.6084/m9.figshare.14191052.v2.