Figures & data
Table 1. List of overall survival associated eRNAs derived from enhancers.
Figure 1. Impact of eRNA PARGP1 on prostate adenocarcinoma (PRAD). (a) Kaplan–Meier survival curve for patients with PARGP1-high and PARGP1-low expression. (b) Scatterplot showing the association between PARGP1 and AGAP4 levels.
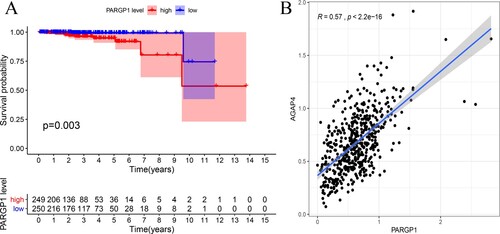
Figure 2. Expression of AGAP4 in tumor and normal prostate tissue.
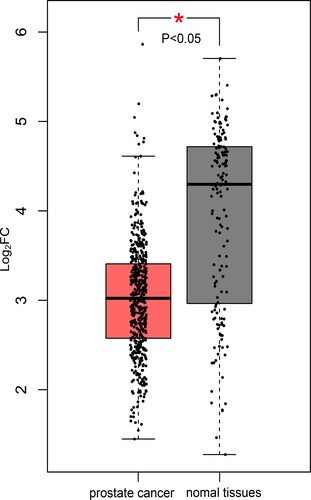
Figure 3. Impact of eRNA PARGP1 on other cancers. (a) Kaplan–Meier overall survival curve for patients with PARGP1-high and PARGP1-low expression on head and neck squamous cell carcinoma (HNSC). (b) Kaplan–Meier overall survival curve for patients with PARGP1-high and PARGP1-low expression in brain lower grade glioma (LGG). (c) Kaplan–Meier overall survival curve for patients with PARGP1-high and PARGP1-low expression on pheochromocytoma and paraganglioma (PCPG).
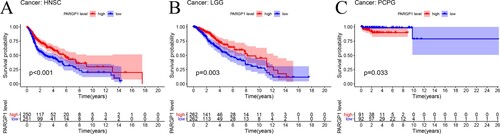
Table 2. Kaplan–Meier survival analysis and gene expression correlations for PARGP1 and AGAP4 across 33 cancer types from the Cancer Genome Atlas (TCGA) project.
Figure 4. Gene expression related to prostate cancer. (a–d) Expression levels of PARGP1 were not related to age in patients with prostate cancer or to the TNM stage of the tumor. (e–f) The difference between the expression level of PARGP1 and the value of PSA. There was a significant difference in PARGP1 expression level for PSA between 0–4 ng/ml and 4–10 ng/ml. (g–h) The expression levels of PARGP1 and AGAP4 were related to biochemical recurrence of prostate cancer (p < 0.05).
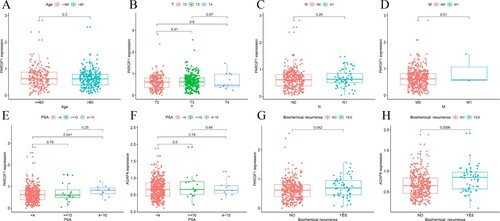
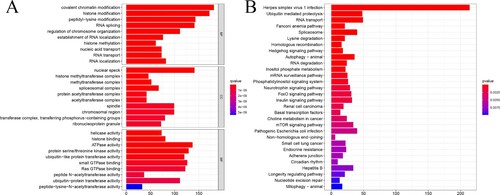
Figure 5. Gene Ontology (GO) and Kyoto Encyclopedia of Genes and Genomes (KEEG)enrichment analysis of co-expressed genes. The ordinate is the name of the metabolic pathway in GO and KEGG, and the abscissa is the number of genes annotated to the pathway.