
Figures & data
Table 1. Sequences of primers used for qPCR.
Figure 1. Characterization of MDSPCs. (A) Flow cytometry analysis for the detection of MDSPCs’ surface markers. (B) Cellular immunofluorescence image of Desmin in MDSPCs, cells nuclei were counterstained with DAPI. (C, D) Myogenic differentiation potential of MDSPCs. Brightfield image of myotube structures (C). Cellular immunofluorescence image of MYHC and nuclei counterstained with DAPI (D). (E, F) Osteogenic and adipogenic differentiation potential of MDSPCs, typical mineralization nodules and lipid droplets stained with Alizarin Red and Oil Red O, respectively. (G) Phase-contrast images of small and large islet-like living clusters spontaneously formed in long-term cultured MDSPCs. Bars, 100 µm .
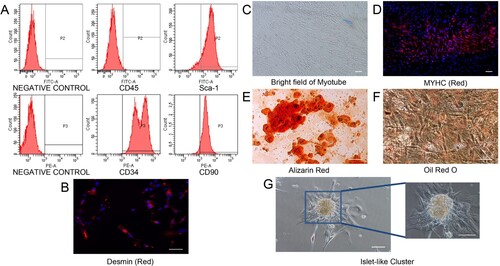
Figure 2. The effect of hypoxia on MDSPCs’ stemness markers and myogenic transcription factors’ genes expression. The qPCR analysis of genes expression of stemness markers (A) and myogenic transcription factors (B) under normoxia or hypoxia for 12 and 24 h (n = 3 per group). Data are represented as mean ± standard deviation. *p < 0.05 versus the normoxia group.
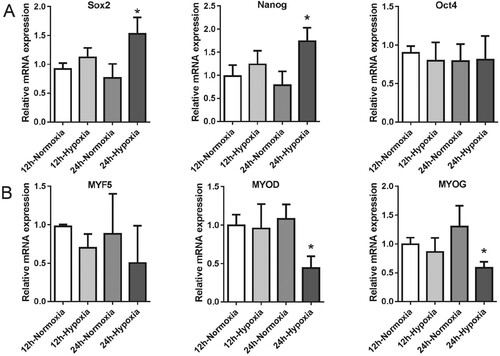
Figure 3. The effect of hypoxia on MDSPCs’ vitality and survival. (A,B) The effect of hypoxia on MDSPCs’ vitality was tested by the CCK-8 assay compared to normoxia with (A) or without (B) serum at 6, 12 and 24 h (n = 6 per group). (C–F) The effect of hypoxic preconditioning on H2O2-induced MDSPCs’ apoptosis by the Hoechst 33342 stained assay (C, D) (n = 3 per group) and the Annexin V-FITC/PI stained flow cytometry assay (E F) (n = 4 per group). (G) The viability of hypoxic preconditioned MDSPCs with H2O2 was tested by the CCK-8 assay (n = 4 per group). (H) The sketch image of trypan blue dye, small arrow demonstrates dead cell, while the big arrow indicates live cell on the hemacytometer. (I) The viability of hypoxic preconditioned MDSPCs with H2O2 was tested by trypan blue dye (n = 4 per group). Bars, 100 µm. Data are represented as mean ± standard deviation. *p < 0.05 versus absence H2O2 group. #p < 0.05 versus normoxia + H2O2 group.
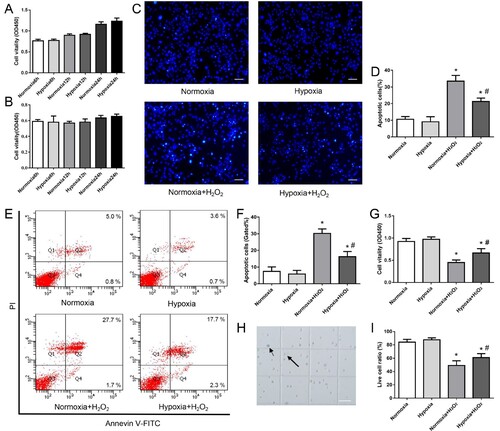
Figure 4. The effect of hypoxia on HIF-1α protein and its downstream target expression of MDSPCs. (A) HIF-1α protein level was measured by western blot under normoxia or hypoxia for 12 and 24 h. (B–E) Gene and protein expression levels of SDF-1 (B, C) and VEGF (D–E) under normoxia or hypoxia for 12 and 24 h were assessed by qPCR and western blot. Data are represented as mean ± standard deviation (n = 3 per group). *p < 0.05 versus normoxia group.
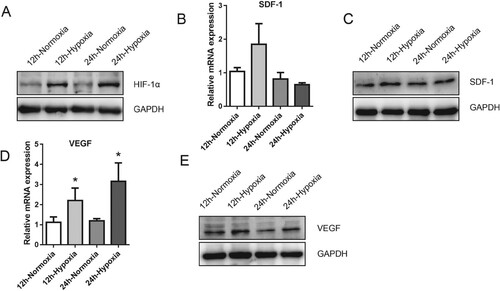
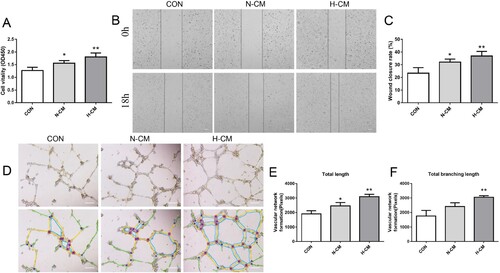
Figure 5. The effect of hypoxia on MDSPCs’ angiogenic ability. (A) The viability of endothelial cells treated with different media was tested by the CCK-8 assay (n = 4 per group). (B, C) The migration capacity of endothelial cells treated with different media was measured by the scratch migration assay (n = 4 per group). (D–F) The angiogenic capacity of endothelial cells treated with different media was measured by the tube formation assay on Matrigel and the images were analyzed by the ImageJ software (n = 3 per group). Bars, 200 µm. Data are represented as mean ± standard deviation. *p < 0.05 or *p < 0.01 versus CON. CON, control; N-CM, condition media from normoxic cultured MDSPCs; H-CM, condition media from hypoxic cultured MDSPCs.
Data availability statement
The data that support the findings of the present study are available at the fig share repository (http://figshare.com/) at https://figshare.com/s/aa3b2eb462a6f9c8aa7d.