
Figures & data
Figure 1. Phenotypic comparison of the two parents in terms of the heading date. (a) Dazhangzi, an early-maturing parent, shows early heading, whereas (b) Kunlun 10, a late-maturing parent, shows late heading.
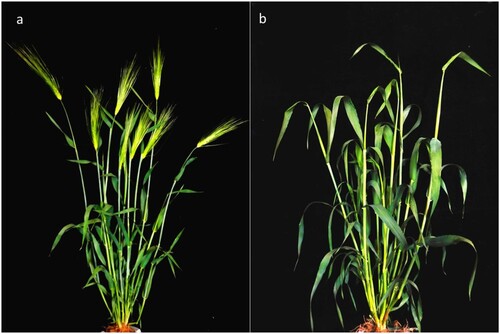
Figure 2. Heading date comparison and distribution of the parents and the F2:3 populations derived from a cross between Dazhangzi and Kunlun 10, which were measured under three spring ecological conditions and environments in 2020 consisting of 20QW (Quanwan), 20MY (Menyuan), and 20XN (Xining).
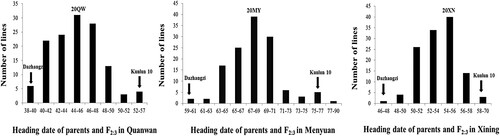
Table 1. Summary statistics of the heading date trait of the parents and the F2:3 populations across 20QW (Quanwan), 20MY (Menyuan), and 20XN (Xining).
Table 2. Analysis of variance and broad-sense heritability of the heading date.
Figure 3. QTL mapping of the heading date trait in the F2:3 population derived from a cross between Dazhangzi and Kunlun 10. Ten heading date QTL that were identified in the three environments are distributed among four chromosomes. The colored lines represent the QTL detected in each environment, and the line with two colors represents the QTL detected in different environments simultaneously. The two consensus QTL are located on the chromosome 2, while the six specific QTL were identified by the single-environment analysis across the three environments.
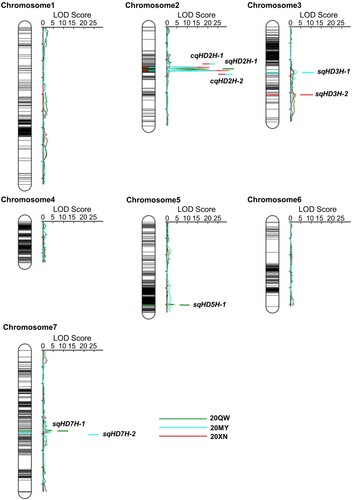
Table 3. Consensus, specific, and identified quantitative trait loci (QTL) of the heading date trait within the F2:3 population in 2020.
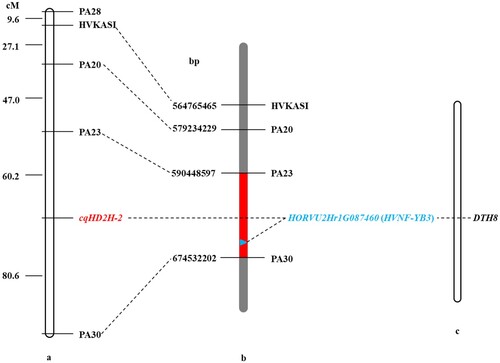
Figure 4. Genetic and comparative mapping of the cqHD2H-2. (a) Linkage map of markers of cqHD2H-2. (b) A partial physical map of the linkage markers surrounding cqHD2H-2. The red region indicates the cqHD2H-2 candidate interval, which corresponds to 590,448,597 bp and 674,532,202 bp. (c) HORVU2Hr1G087460 gene corresponding homologous genes of DTH8 of rice.
Supplemental Material
Download MS Word (12.7 KB)Data availability statement
The data that support the findings of this study are openly available in figshare.com at https://doi.org/10.6084/m9.figshare.14866248.v4.