
Figures & data
Table 1. Concentration series for calibration curve of Trolox.
Figure 1. Average of temporal evolution of the antioxidant activity of natural extracts and BTS. Blue corresponds to Cymbopogon citratus, black for Hypericum perforatum and red corresponds to BTS.
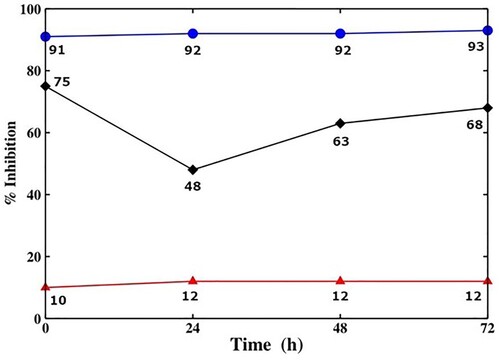
Table 2. Total phenolic contents of Cymbopogon citratus and Hypericum perforatum extracts.
Figure 2. A peak corresponding to fructose in Hypericum perforatum can be observed under the limit quantification 4 min after release.
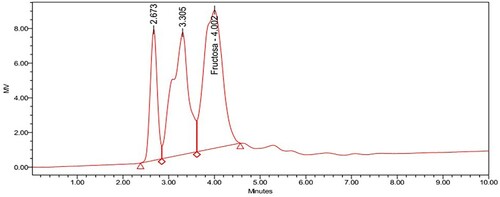
Figure 3. A peak corresponding to glucose in Cymbopogon citratus can be observed under the limit quantification 3.7 min after release.
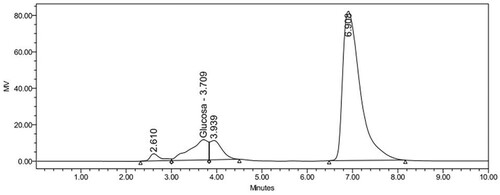
Table 3. Seminal motility averages for all times and extender types.
Table 4. Seminal viability averages for all times and extender types.
Table 5. Average of primary morphologies of seminal doses preserved with different extenders and their specific concentrations at 24 and 72 h.
Data availability statement (DAS)
The data that support the findings of this study are available in Figshare at https://doi.org/10.6084/m9.figshare.13363559.