
Figures & data
Figure 1. TLC analysis of the culture filtrate of Hypomyces perniciosus. (A) under UV light; (B) sprayed with Folin-Ciocalteu reagent.
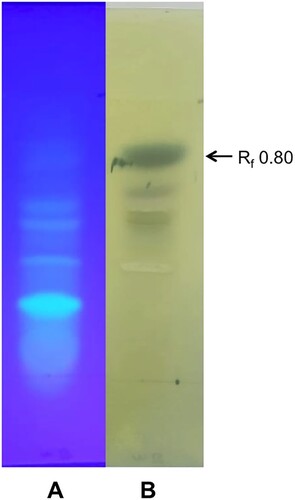
Figure 2. UPLC chromatograms of phenolic acid standards (A) and the compound eluted at Rf 0.8 from the TLC plate (B).
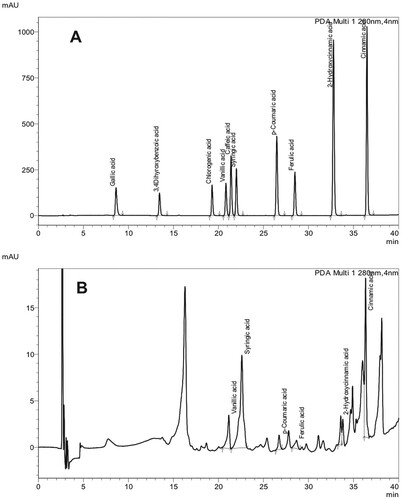
Table 1. Phenolic acids detected in the fraction at Rf 0.8 purified from the culture filtrate of Hypomyces perniciosus.
Data availability statement
The data supporting the findings of this study are available in Mendeley Data, V1, doi: 10.17632/mk5tjfg4j7.1 (https://data.mendeley.com/datasets/mk5tjfg4j7/1).