
Figures & data
Figure 1. Tumor growths were slower in ApoE −/− mice. (A) Tumor growth curves of B16F10 were measured in WT and ApoE −/− mice. n = 6; ***p < .001. (B) The tumor weights of B16F10 from WT and ApoE −/− mice were measured when the mice were sacrificed. n = 3; **p < .01. (C) Typical tumor photos of MC38 from WT and ApoE −/− mice were shown. (D) Tumor growth curves of MC38 cells were measured in WT (n = 4) and ApoE −/− (n = 5) mice. ***p < .001.
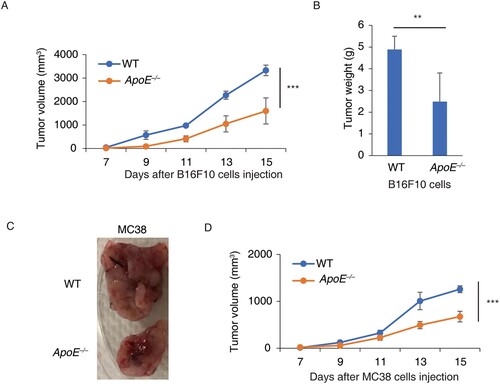
Figure 2. Tumor-infiltrating T cells and macrophages were increased in ApoE −/− mice. CD3+ cell percentages were measured in splenocytes and tumor-infiltrating lymphocytes (TIL) from WT and ApoE −/− mice. (A) Typical FACS photos were shown. (B) The statistic results were shown. n = 3; *p < .05; NS, not significant. Macrophage percentages were measured in splenocytes and TIL from WT and ApoE −/− mice. (C) Typical bivariant plots were shown (D) CD11b+ cell percentages in CD3− CD45 + cell were shown. (E) CD11C+ cell percentages in CD11b+ CD3− CD45 + cells were shown. n = 3; *p < .05; NS, not significant.
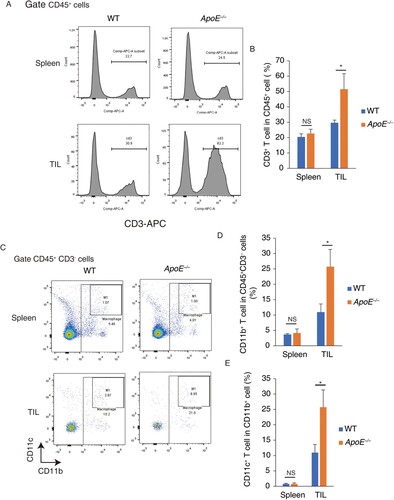
Figure 3. Tumor-infiltrating cytotoxic CD8+ T cell were increased in ApoE −/− mice. CD4+ and CD8+ T cell percentages were measured in splenocytes and TIL from WT and ApoE −/− mice. (A) Typical FACS bivariant plots were shown. (B) CD4+ T cell percentages in CD45 + cells were shown. (C) CD8+ T cell percentages in CD45 + cells were shown. n = 3; *p < .05; NS, not significant. TNF-α+ (D), IFN-γ+ (E), GZMB+ (F) and Ki67+ (G) CD8+ T cells percentage were measured in tumor-infiltrating cytotoxic CD8+ T cells from WT and ApoE −/− mice. n = 3; **p < .01.
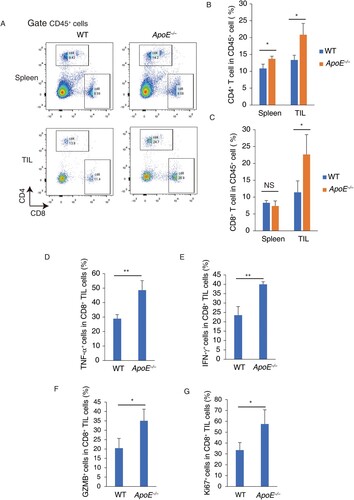
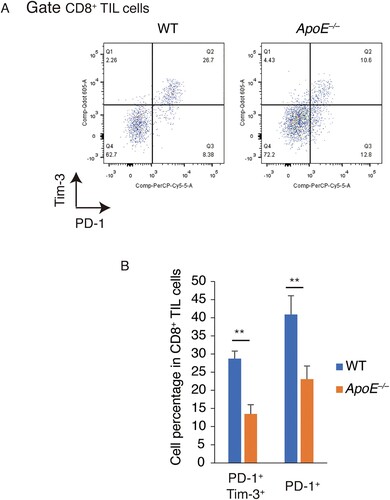
Figure 4. Exhausted tumor-infiltrating CD8+ T cell were decreased in ApoE −/− mice. PD-1+ and Tim-3+ CD8+ T cells were measured in tumor-infiltrating CD8+ T cells from WT and ApoE −/− mice. (A) Typical FACS bivariant plots were shown. (B) The statistic results were shown. n = 3; **p < .01.
Data availability statement
The data that support the findings of this study are available in ‘figshare’ at https://doi.org/10.6084/m9.figshare.15260400.