
Figures & data
Figure 1. Changes of LVEDD. The LVEDD of rats in model group, group A, group B, group C and group D were significantly decreased, of which group D had the largest decrease (P < 0.001). Group A, group B, group C and group D were compare with the model group. *means P < 0.05, ***means P < 0.001.
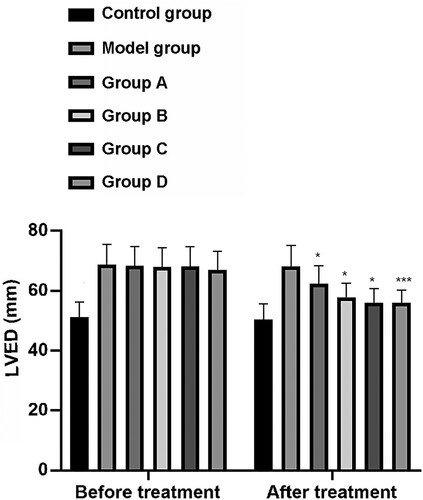
Figure 2. Changes of LVEF. LVEF in model group, group A, group B, group C and group D were significantly increased, with group D having the largest increase. Group A, group B, group C and group D were compare with the model group. ***means P < 0.001.
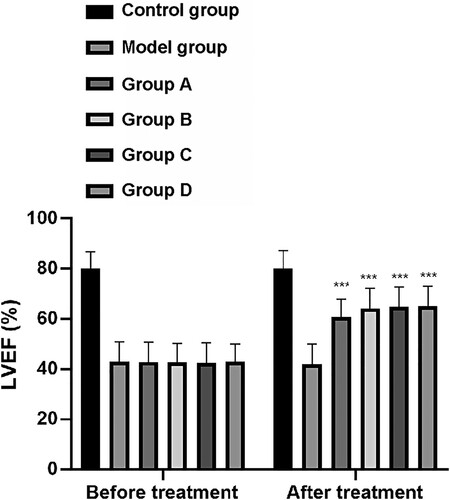
Figure 3. Changes of CD3+. After treatment, CD3+ in model group, group A, group B, group C and group D was significantly increased. Among them, the up-regulation of group A was significantly larger than that of model group, while the up-regulation of group B, group C and group D was significantly larger than that of group A (P < 0.001). Group A, group B, group C and group D were compare with the model group. ***means P < 0.001.
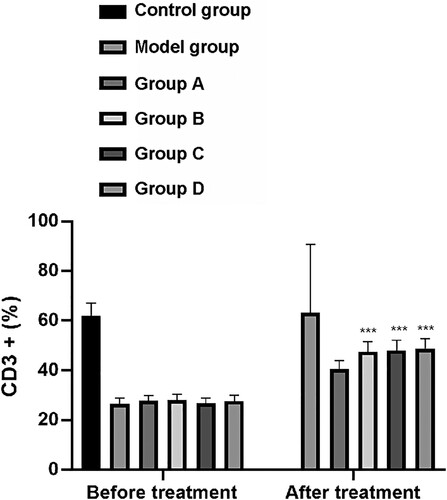
Figure 4. Changes of CD4+/CD8+. After treatment, CD4+/CD8+ in model group, group A, group B, group C and group D rats were significantly increased. Among them, the up-regulation of group A was significantly larger than that of model group, while the up-regulation of group B, group C and group D was significantly larger than that of group A (P < 0.05). Group A, group B, group C and group D compare were with the model group. *means P < 0.05.
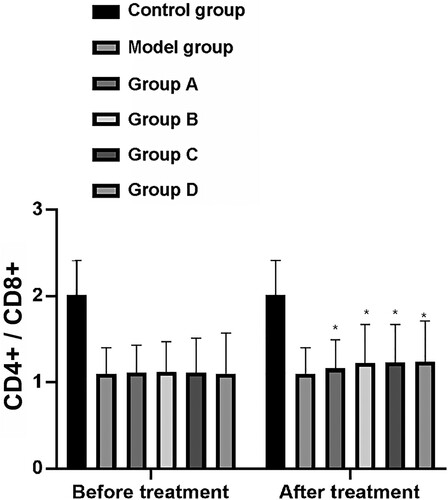
Figure 5. Changes of Galectin-3. After treatment, Galectin-3 in model group, group A, group B, group C, and group D was significantly decreased, with group D having the largest decrease. Group A, group B, group C and group D were compare with the model group. ***means P < 0.001.
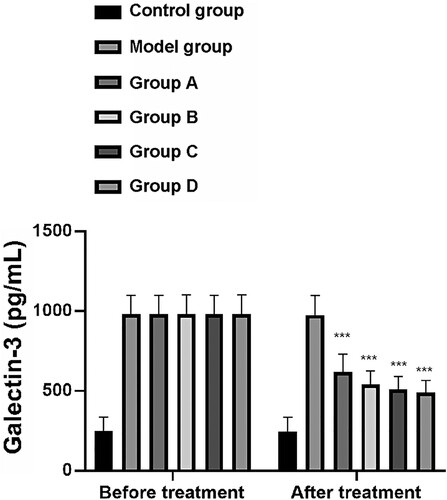
Figure 6. Changes of HSP70. After treatment, HSP70 in model group, group A, group B, group C and group D decreased significantly, of which group D had the largest decrease. Group A, group B, group C and group D were compare with the model group. ***means P < 0.001.
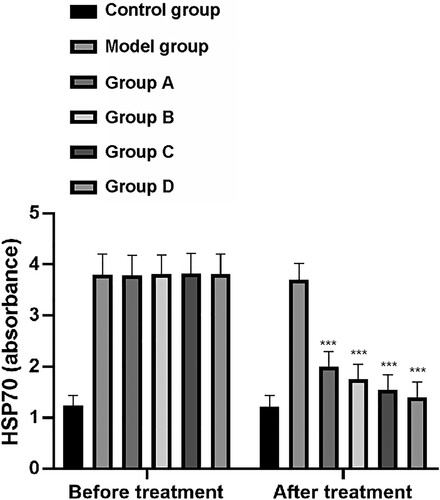
Figure 7. Changes of IL-8. The level of IL-8 in group D was the lowest, which was significantly lower than that in the combined group. Group A, group B, group C and group D were compare with the model group. *means P < 0.05, **means P < 0.01, ***means P < 0.001, ameans P < 0.001.
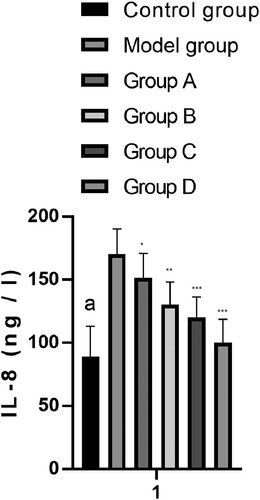
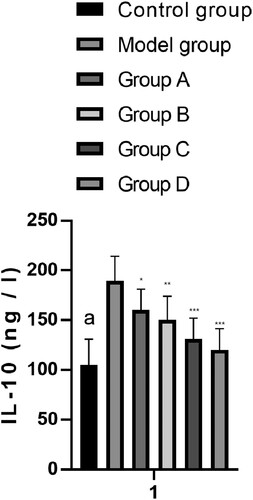
Figure 8. Changes of IL-10. The level of IL-10 in group D was the lowest, which was significantly lower than that in the combined group. Group A, group B, group C and group D were compare with the model group. *means P < 0.05, **means P < 0.01, ***means P < 0.001.
Data availability statement
The data that support the findings of this study are openly available in figshare at http://doi.org/10.6084/m9.figshare.16800871.