
Figures & data
Figure 1. Volcano plot of differentially expressed genes (DEGs). The red dots represent the upregulated DEGs and the blue dots indicate the downregulated DEGs.
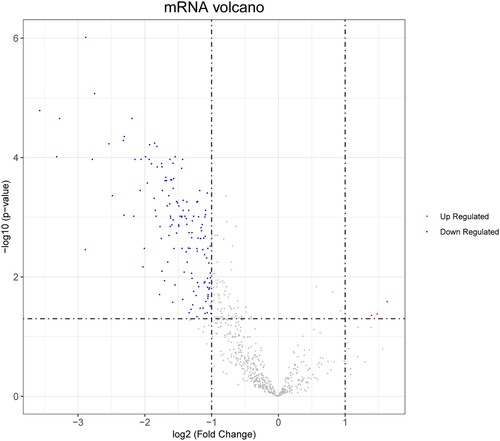
Figure 2. Gene Ontology (GO) and Kyoto Encyclopedia of Genes and Genomes (KEGG) enrichment analyses of survival-related genes. The black line denotes the p value and the length of the bars shows the number of genes.
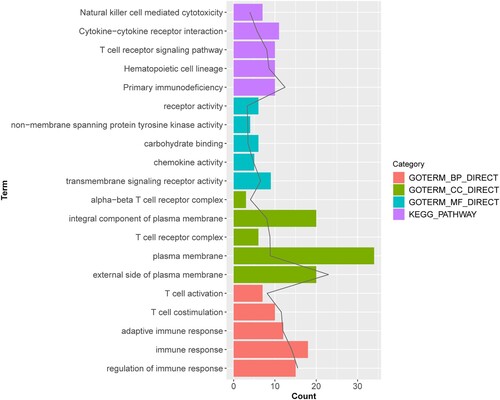
Figure 3. The protein-protein interaction (PPI) network and sub-module network of survival-related genes. (A) PPI network; (B) significantly enriched sub-module network. The green circular nodes represent the downregulated genes.
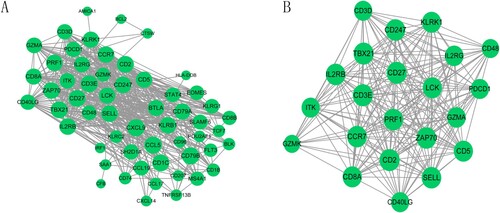
Table 1. Top 15 hub genes in protein-protein interaction and sub-module network.
Figure 4. Transcriptional regulatory network. The green circles represent the downregulated genes; the purple triangles represent the miRNAs; and the yellow hexagons represent the transcription factors.
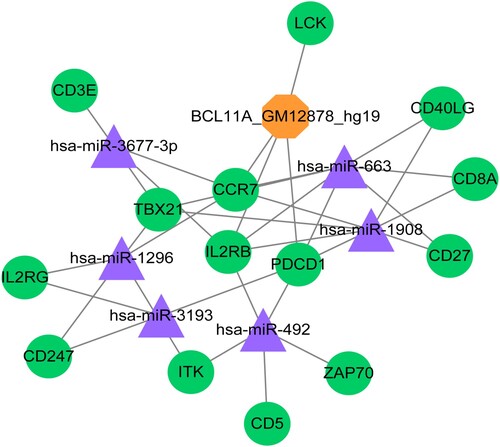
Table 2. The interaction pairs among miRNAs, transcription factors and genes.
Data availability
The data that support the findings of this study are publicly available in the GEO database (https://www.ncbi.nlm.nih.gov/geo/) under the accession number GSE102818.