
Figures & data
Figure 1. Strategy for genome-scale CRISPR screen. (A) shows the schematic depiction of the sgRNA library. (B) Library is packaged into lentiviral. (C) Viral titer and MOI are determined. (D) A gel shows amplification of the sgRNA library. (E) Lentivirus containing sgRNA is spinfected into glioma cells. (F) Transduced cells are selected with puromycin, after which some cells are harvested for baseline sgRNA representation. The rest of the cells are placed under the treatment of temozolomide/DMSO/puromycin for 14 days. (G) Cells are harvested, sgRNA extracted and sequenced on NEXT-generation sequencers.
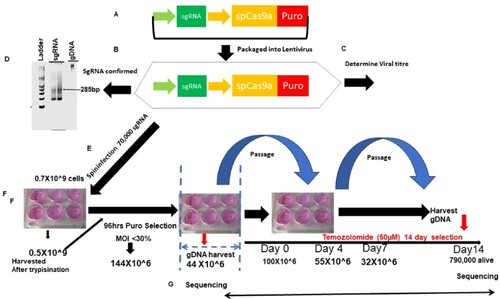
Figure 2. Kinetics of cell selection pressure under chemotherapy in genome-scale CRISPR screen. (A) shows the schematic depiction of the number of T225 flask of cells starting from over half a billion cells to the number that remains after 14 days of selection.
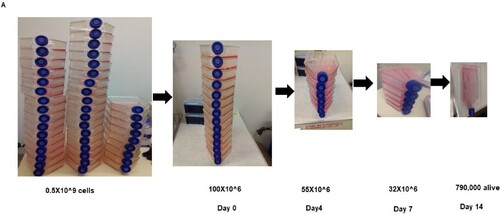
Figure 3. Morphology of cells transduced with CRISPR library under drug selection compared to wild-type control. (A) shows U251 cells transduced with sgRNA treated with temozolomide for 14 days, and (B) shows normal U251 wild-type controls.
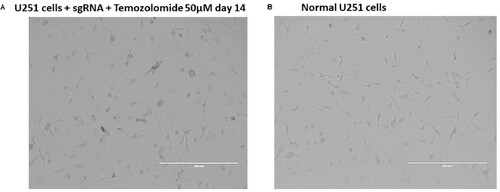
Figure 4. PCR amplification of sgRNA from the library, puromycin, DMSO and temozolomide-selected glioblastoma: (A–C) shows agarose gel pic of the sgRNA amplified from the library, puromycin, DMSO and temozolomide-treated cells. (D–F) shows electropherogram measurement of the amplified sgRNA from different conditions.
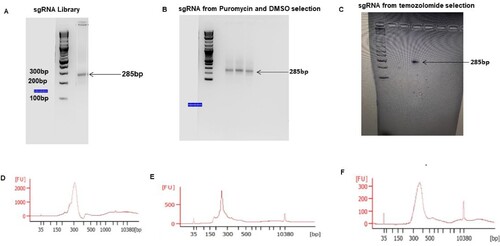
Figure 5. Alignment of Next Seq sgRNA reads from the library, DMSO and temozolomide-treated cells. (A) shows the mapping of sgRNA library (75.78%) DMSO (81.8%) and temozolomide (61.33%) mapped to the human reference genome. (B) shows the number of genes and sgRNA missing from the mapped library, which were few.
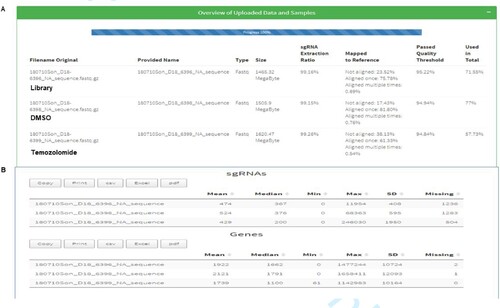
Figure 6. Cumulative frequency of sgRNA distribution in CRISPR library, DMSO and temozolomide-treated glioblastoma cells. A shows a cumulative frequency distribution of log 2 sgRNA read count in sgRNA library (red), sgRNA DMSO (blue) and sgRNA temozolomide (green).
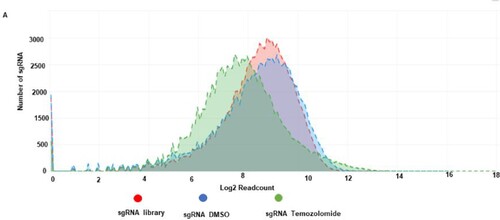
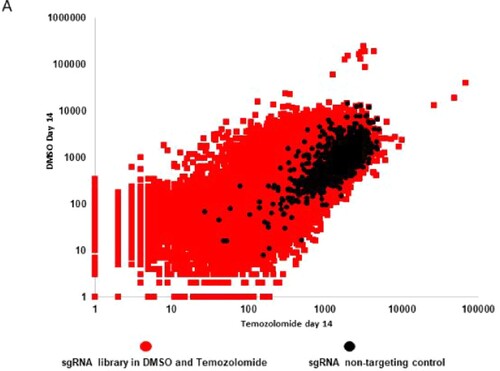
Figure 7. Scatter plot distribution of sgRNA in DMSO versus temozolomide-treated glioblastoma cells. A Scatter plot depicting sgRNA distribution in DMSO (y-axis) and temozolomide (x-axis) and their non-targeting controls (black dots).
Data availability statement
The data that support the findings of this study are available in the Zenodo repository at https://doi.org/10.5281/zenodo.5167143. Data 1: 5953 DMSO Day 14 Rep2; Data 2: 6377 Library; Data 3: 6396 Puromycin Day 0; Data 4: 6397 Puromycin Day 14; Data 5: 6398 DMSO Day 14 Rep1; Data 6: 6399 Temozolomide Day 14.