
Figures & data
Figure 1. The workflow diagram.
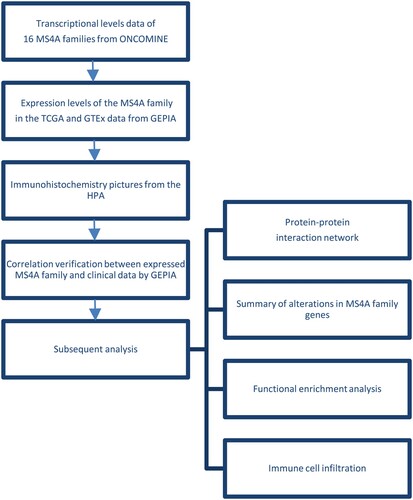
Figure 2. mRNA levels of MS4A family genes in different cancer. The figure demonstrates the numbers of mRNA datasets of MS4A family genes in different cancers. Determined according to the following numerical thresholds: p-value ≤ 0.001, fold change ≥2, and gene ranking of all.
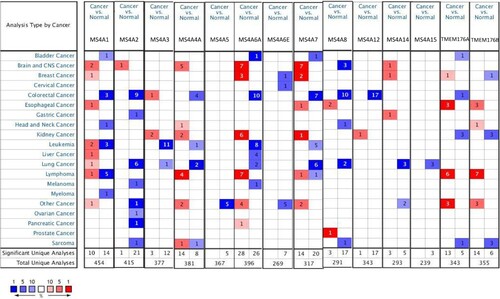
Table 1. Differential expression analyses of MS4A family in lung cancer.
Figure 3. The transcription levels of MS4A family genes in lung cancer. The transcriptional levels of MS4A2, MS4A4A4A, MS4A4E, MS4A7, MS4A14, and MS4A15 were significantly reduced in lung adenocarcinoma (LUAD). In lung squamous cell carcinoma(LUSC) MS4A2, MS4A4A, MS4A4E, MS4A6A, MS4A7, MS4A8, MS4A14, and MS4A15 transcript levels were decreased. The p value was set at 0.05.
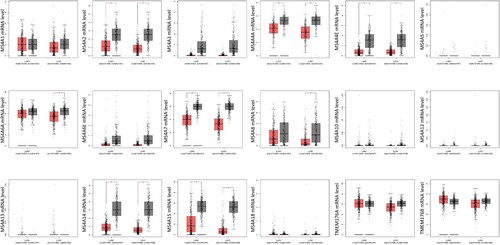
Figure 4. The expression matrix plot of MS4A family genes in lung cancer. MS4A6A, TMEM176A, and TMEM176B had the highest relative expression among all MS4A families.
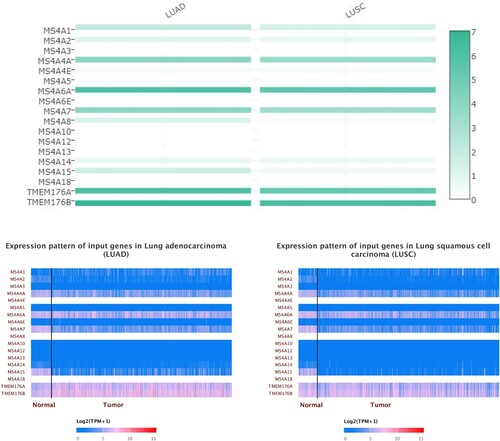
Figure 5. Immunohistochemistry pictures from HPA display the protein expression levels of MS4A family in lung cancer.
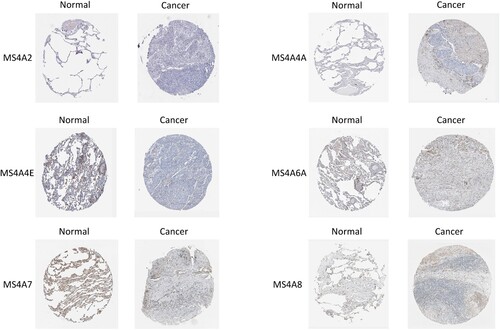
Figure 6. The Pathological Stage Plot and Survival plot of MS4A family genes in lung cancer. (A)The expressions of MS4A2, MS4A8, and MS4A15 are significantly correlated with pathological stage. (B) Survival curve analysis based on MS4A family genes expression.
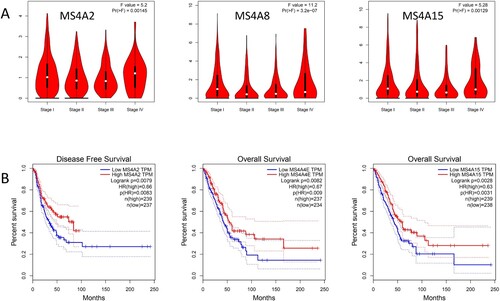
Figure 7. Genetic alteration and PPI network analyses of MS4A family genes in lung cancer patients. (A) Summary of alterations in MS4A family genes in lung cancer. (B,C) Protein-protein interaction network of MS4A family genes.
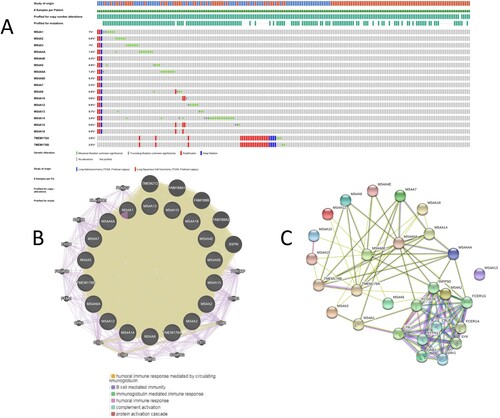
Figure 8. The Go and KEGG enrichment analysis of MS4A family genes. (A) GO enrichment Bar plot in cellular component terms, biological process terms, and molecular function terms. (B) Enrichment dot bubble of KEGG enriched terms.
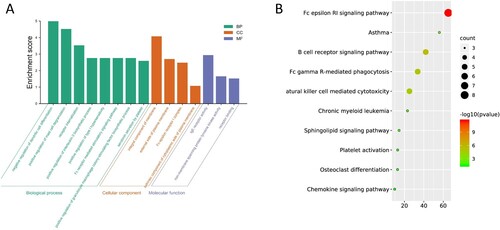
Figure 9. Correlation between differential expression of MS4A family genes and immune cell infiltration.
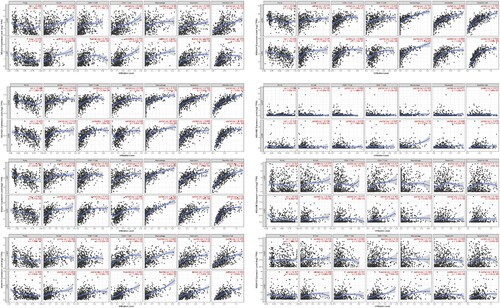
Table 2. The cox proportional hazard model of differentially expressed MS4A family and six tumor-infiltrating immune cells in LUAD and LUSC.
Data availability statement
The data that support the findings of this study are openly available in [Oncomine] at [https://www.oncomine.org/resource/login.html], reference number (Rhodes et al. Citation2004), [Gene Expression Profiling Interactive Analysis (GEPIA)] at [http://gepia.cancer-pku.cn/index.html], reference number (Tang et al. Citation2017), [The Human Protein Atlas (HPA)] at [https://www.proteinatlas.org/], reference number (Thul and Lindskog Citation2018), [cBioPortal] at [www.cbioportal.org], reference number (Gao et al. Citation2013), [STRING] at [https://string-db.org/], reference number (Szklarczyk et al. Citation2019), [DAVID] at [https://david.ncifcrf.gov], reference number (Huang et al. Citation2009), [Tumor Immune Estimation Resource(TIMER)] at [http://timer.cistrome.org], reference number (Li et al. Citation2017).