Figures & data
Figure 1. Tobacco alkaloid content under different treatments TW, tobacco group subjected to topping treatment only; TS, tobacco group treated by topping and 0.6 mM SA; NS, tobacco group only receiving 0.6 mM SA; NW, control group.
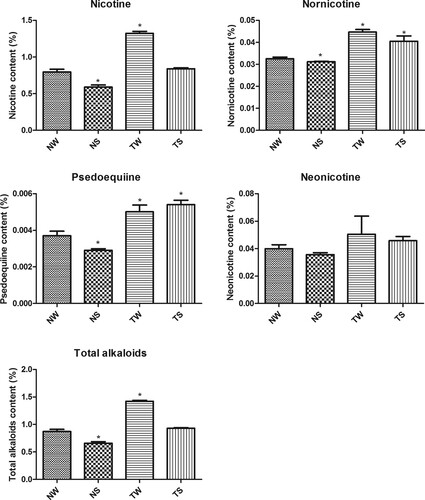
Figure 2. PLS-DA analysis TW, tobacco group subjected to topping treatment only; TS, tobacco group treated by topping and 0.6 mM SA; NS, tobacco group only receiving 0.6 mM SA; NW, control group.
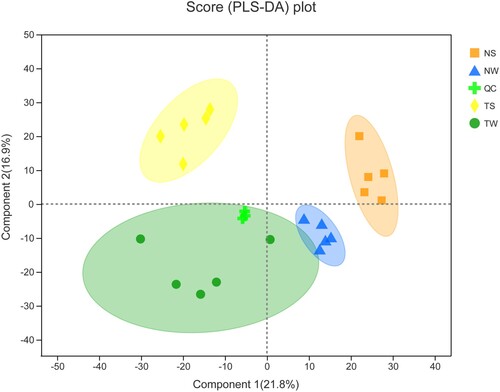
Figure 3. Differentially expressed genes-differential metabolites network in (A) NS vs NW, (B) TW vs TS, (C) TW vs NW, and (D) NS vs TS TW, tobacco group subjected to topping treatment only; TS, tobacco group treated by topping and 0.6 mM SA; NS, tobacco group only receiving 0.6 mM SA; NW, control group. The red circle represents the up-regulated protein, the green circle represents the down-regulated protein, the blue square represents the metabolite, the red line represents the positive correlation, and the green line represents the negative correlation.
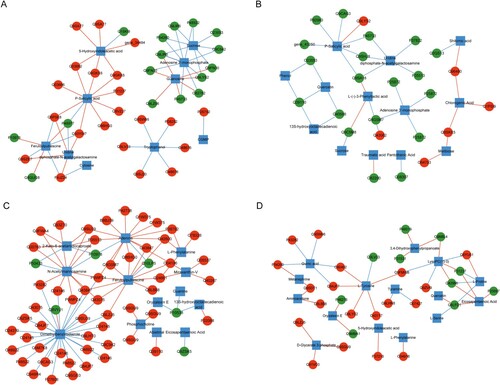
Figure 4. Differentially expressed genes-KEGG pathway-differential metabolites network in (A) NS vs NW, (B) TS vs NS, (C) TS vs TW, and (D) TW vs NW TW, tobacco group subjected to topping treatment only; TS, tobacco group treated by topping and 0.6 mM SA; NS, tobacco group only receiving 0.6 mM SA; NW, control group. The red circle represents the up-regulated protein, the green circle represents the down-regulated protein, the orange hexagon represents the pathway, the blue square represents the metabolite, the red line represents the positive correlation, and the green line represents the negative correlation.
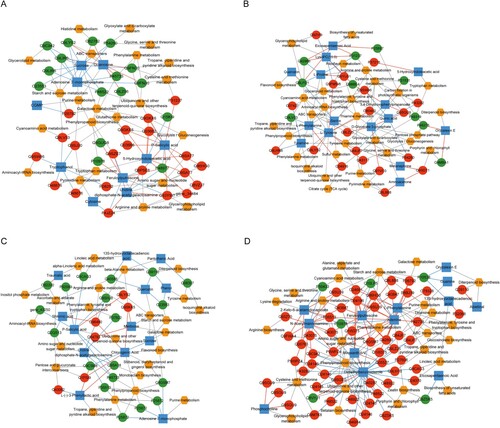
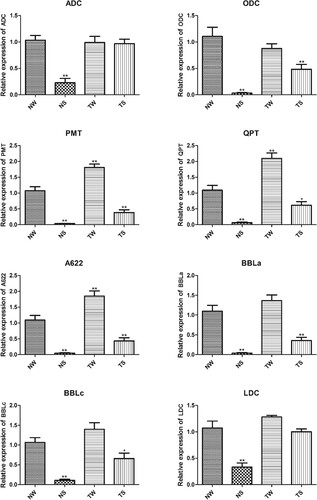
Figure 5. RT-qPCR detection of the relative expression of genes related to nicotine synthesis TW, tobacco group subjected to topping treatment only; TS, tobacco group treated by topping and 0.6 mM SA; NS, tobacco group only receiving 0.6 mM SA; NW, control group.