Figures & data
Table 1. Details of the GEO colorectal cancer data.
Figure 1. (A)Volcano plot of gene expression profile data between clcorectal cancer and normal tissues in each dataset. Red dots: significantly up-regulated genes in CRC; Blue dots: significantly down-regulated genes in CRC; Black dots: non-differentially expressed genes. P < 0.05 and |log2 FC| >1 were considered as significant.(B) The Venn diagram of 172 overlapping DEGs among five datasets.(C) Cluster heat map of the top 100 DEGs in five GEO databases. Red indicates relative upregulation of gene expression; blue indicates the relative down-regulation of gene expression; gray indicates no significant change in gene expression; and white indicates that the signal intensity is not high enough to detect.

Figure 2. (A) GO analysis of upregulated DEGs. (B) GO analysis of downregulated DEGs.(C) KEGG pathway of DEGs. (D) Function annotation of DEGs. Each node is a Kyoto Encyclopedia of Genes and Genomes pathway item. The node size reflects pathway significance (fdr): the smaller the fdr value, the larger the node size is. Edge between nodes reflects shared or common genes: the wider the edge, the larger the overlap is. Different node colors represent different functional groups.
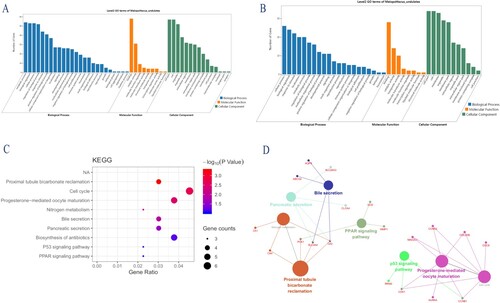
Table 2. Gene ontology analysis of DEGs related to colorectal cancer.
Table 3. Kyoto Encyclopedia of Genes and Genomes (KEGG) pathway analysis of integrated DEGs.
Figure 3. PPI and MCODE analyses of DEGs. (A) Protein–protein interaction network of 90 DEGs. (B) The protein-protein interaction(PPI) network of top 10 hub genes.(C) A signifcant module, containing 19 up-regulated proteins, was selected from PPI network. (C) Another module selected from PPI network. For (A, C, D), red nodes are up-regulated proteins, and blue nodes are down-regulated proteins. Circles represent genes, lines represent interactions between gene-encoded proteins and line colors represent evidence of interactions between proteins.
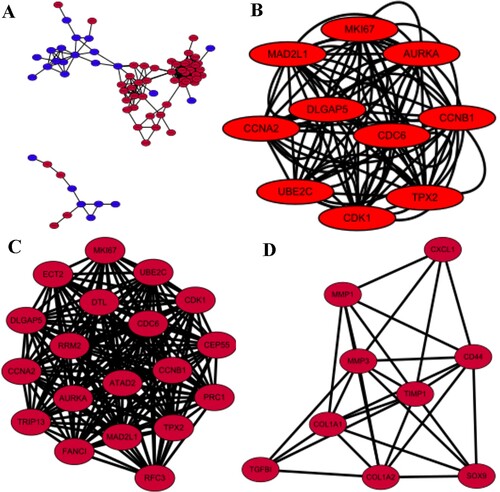
Table 4. The degree values of the top 10 hub genes.
Table 5. KEGG enrichment of genes in the top 2 modules.
Figure 4. The expression level of CDK1, MKI67, CDC6 and MAD2L1 between CRC and normal tissues in five datasets.
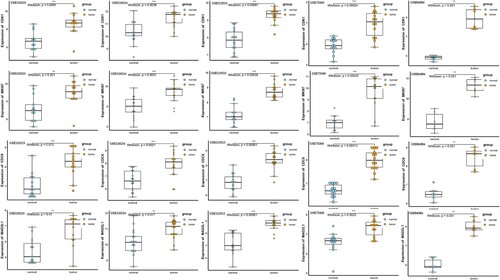
Figure 5. (A) The expression level of CDK1, MKI67, CDC6 and MAD2L1 hub genes between CRC and normal in COAD and READ in GEPIA database. (B) Representative immunohistochemistry staining results reveal the protein level expression of CDK1, MKI67, CDC6 and MAD2L1 in colorectal cancer. (C) The top 20 candidate small molecules targeting the gene expression of CRC.(D) The prognostic value of hub genes according to the Kaplan Meier-plotter online database. Abbreviations: COAD:colon adenocarcinoma; READ:rectal adenocarcinoma; CRC: colorectal cancer.
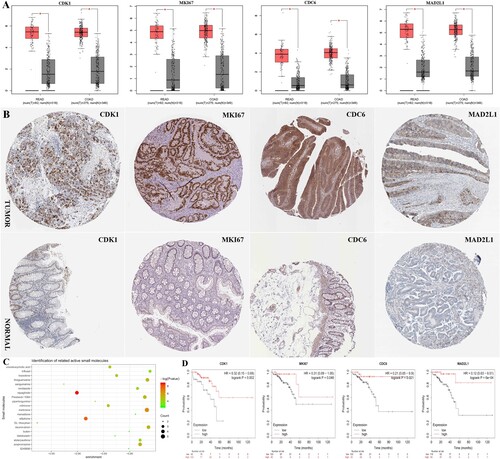
Table 6. List of the 20 most significant small molecule drugs that can reverse the tumoral status of colorectal cancer.
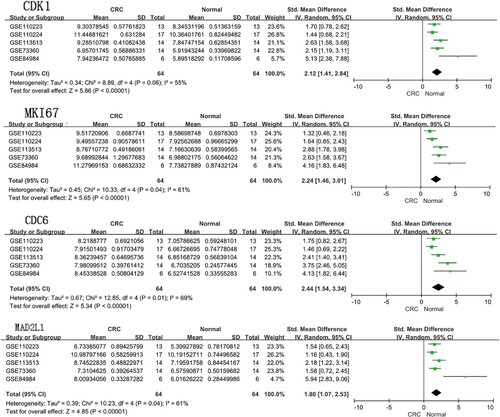
Figure 6. Meta-analysis of the expression amount of CDK1, MKI67, CDC6 and MAD2L1 among the five datasets. Abbreviations: CRC: colorectal cancer.
Data availability
The following information was supplied regarding data availability: The data is available at NCBI GEO: GSE110223, GSE1110224, GSE113513, GSE84984 and GSE73360. The GEO database is available at the following websites: https://www.ncbi.nlm.nih.gov/geoprofiles/
