
Figures & data
Figure 1. Schematic representation of the catheter sequence with guide, intermediate catheter, microcatheter and stent retriever.
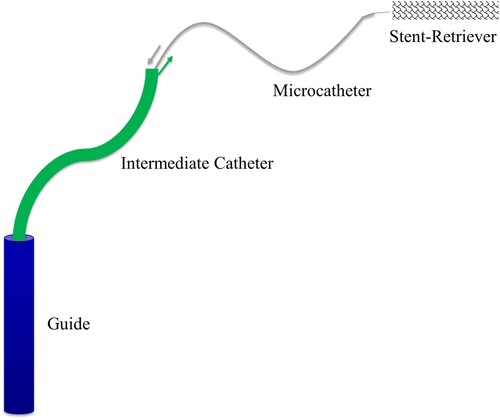
Figure 2. Thrombus types and their compositions. From red to white thrombi with increasing or decreasing amounts of fibrin, erythrocytes and calcium.
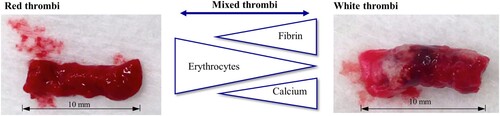
Figure 3. Hounsfield units of blood and thrombi according to (Mecke Citation2008; Vock and Woermann Citation2021).
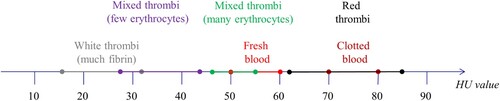
Figure 4. Thrombus mechanical properties – their correlations and influencing factors information based on (Ryan et al. Citation1999; Chueh et al. Citation2011, Citation2012; Vidmar et al. Citation2015; Johnson et al. Citation2017; Gunning et al. Citation2018; Weafer et al. Citation2019). + indicates an increase, while – shows a decrease (e.g. when the thrombocyte content increases, the density of the thrombus increases).
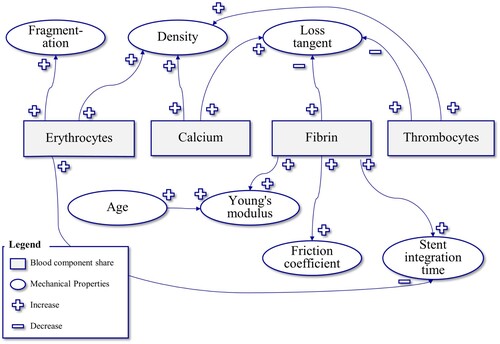
Figure 5. HANNES (a) in the clinical environment, (b) enlargement of the anatomical blood vessel model in the head
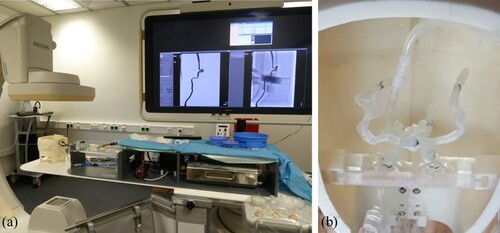
Table 1. Physical requirements for a synthetic thrombus model (D = demand), (W = wish).
Table 2. Functional requirements for a synthetic thrombus model (D = demand), (W = wish).
Figure 6. Material diagrams of the systematic material selection using the CES-Selector software. Narrowing down the materials according to (a) the first selection with young's modulus and density, (b) the second selection with Young's modulus ≤ 0.001 GPa and (c) the third selection with tensile strength and hardness – Vickers as well as ‘usability in water’ and ‘non-toxic’.
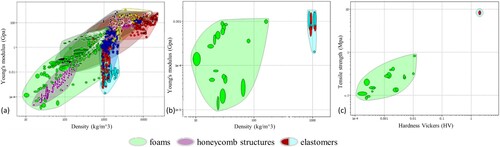
Table 3. Extract from the material list of the CES selector after the third selection.
Figure 7. Design of the combined agarose thrombus model with stabilization by (a) a spiral structure, (b) a wave structure, (c) a barbed structure, additively manufactured (Wortmann et al. Citation2021).
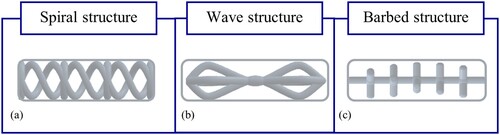
Figure 8. Preparation of agarose thrombi by casting into a homemade mould with a diameter of 2.5 mm.
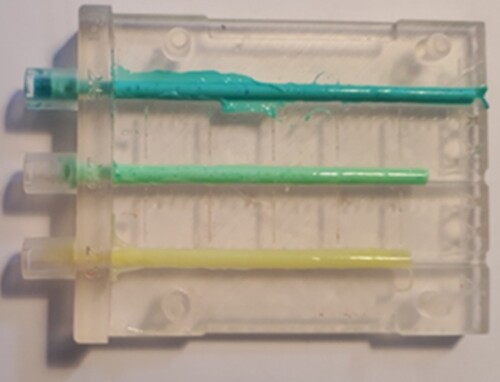
Figure 9. Combined thrombus models of AM structure and agarose stained with food colouring, (a) barbed structure, (b) spiral structure, (c) a wave structure.
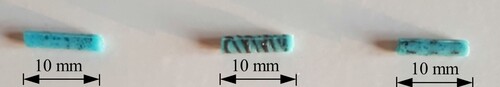
Figure 10. Test environment for the first preliminary tests to narrow down the materials. An intracranial aneurysm model was printed from a block of clear resin on Formlabs Form 2 (a), coloured silicone thrombus (base 3: catalyst 2) in the test environment (b).
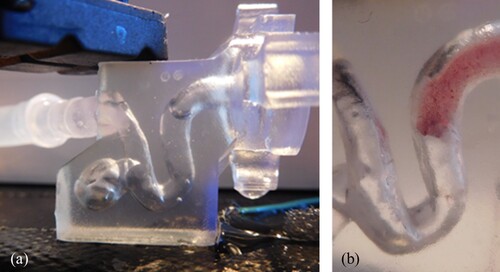
Figure 11. Blood vessel models in the HANNES model in the first and second test. The skull base is made of Clear Resin (Formlabs) and the ICA and intracranial model are made of Elastic Resin (Formlabs).
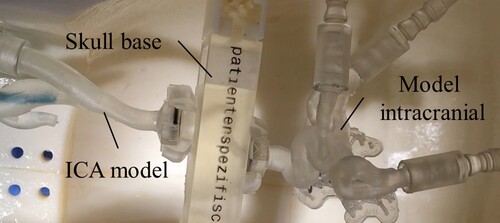
Figure 12. Whole-brain vessel model in HANNES for the final test series. For this purpose, another ICA model was connected as well as the posterior cervical arteries, the vertebral models.
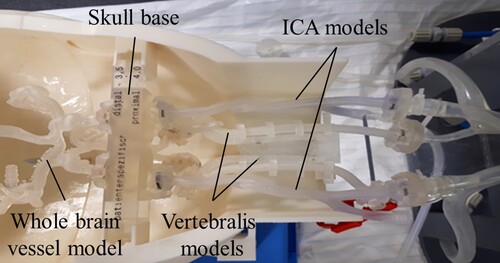
Figure 13. Qualitative evaluation of various parameters using porcine blood thrombi with and without barium. The reference range (green) was derived from this.
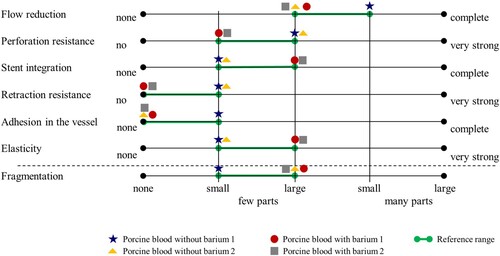
Figure 14. Graphical evaluation of the potential thrombus material classes with respect to their fragility and hardness after the preliminary tests. The favourites were highlighted in medium blue, dark blue and light green.
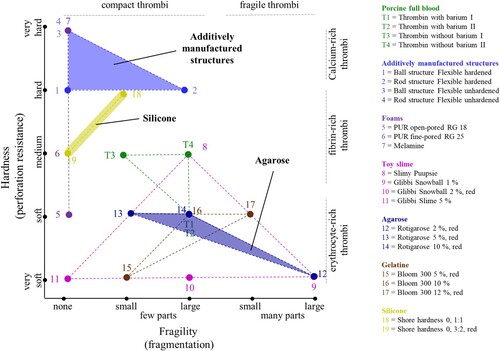
Figure 15. Visualization by angiography and contrast medium. Occlusion of the A. cerebri media by a stamped test body of 2% agarose (a) and occlusion of the skull base by a stamped test body of 5% agarose (b).
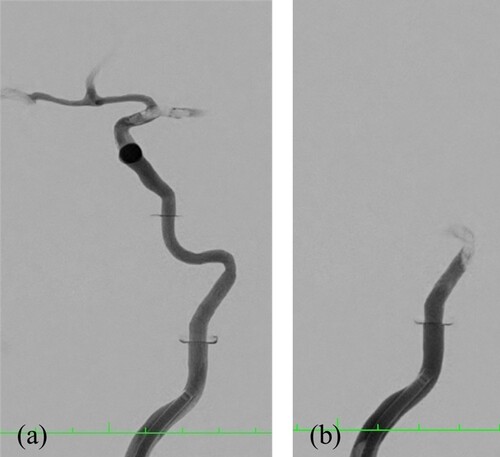
Table 4. Results from the first test of the series of tests on HANNES.
Table 5. Results from the second test of the series of tests on HANNES.
Table 6. Results from the third test of the series of tests on HANNES.
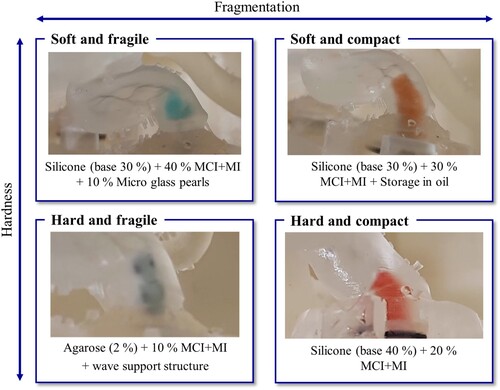
Figure 16. Selection and classification of thrombus models based on the properties of hardness and fragmentation in the defined categories.
Data availability statement
The data that support the findings of this study are openly available in Thrombus – Experiments at https://doi.org/10.15480/336.3773.
Acknowledgements
The authors would like to thank Philips Healthcare for the support and realization of the ‘Hermann Zeumer Research Laboratory’ including a Philips Allura Clarity Angiography system.