Figures & data
Figure 1. A: A map that shows the hot spring from Anhui Province, China; B: Sampling location in the town of Bantang, satellite photo. Red marks the location of the Bantang hot spring (31°38′ 50.05″N, 117°54′50.21″E).
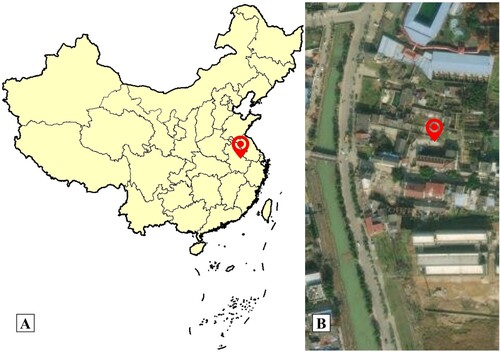
Figure 2. Rank-abundance curve of microbiome diversity in the hot spring water.
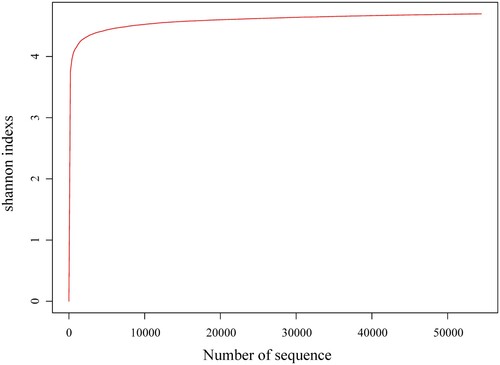
Table 1. Sample sequencing information and alpha diversity of microbiome in the hot spring water.
Figure 3. Graphlan chart representation of taxonomic classification and phylogenetic tree of the hot spring water metagenome.
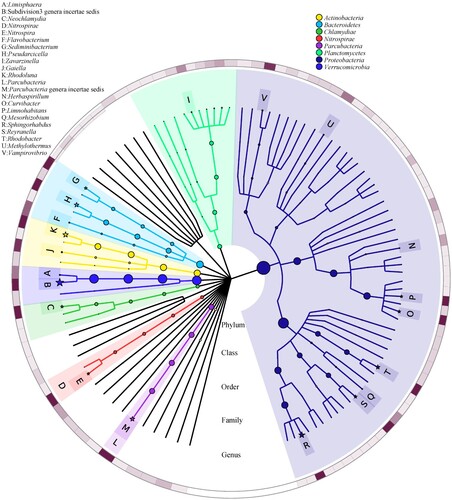
Figure 4. Phylum level distribution of the microbiome population present in the hot spring water.
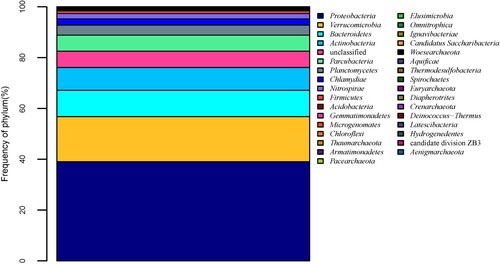
Figure 5. Genus level distribution of microbiome population present in the hot spring water.
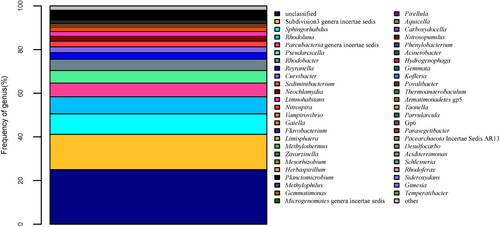
Figure 6. Family level distribution of microbiome population present in the hot spring water.
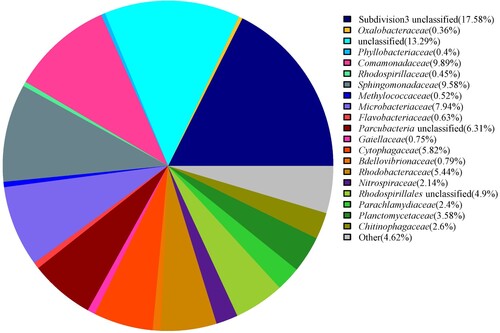
Table 2. Relative abundance of the bacterial (more than 0.5%) and archaea phylum and genus in the hot spring water.
Figure 7. Phylogenetic tree based on 16S rRNA gene sequences of microbiome constructed by Maximum-likelihood method and Tamura 3-parameter model, numbers on the nodes are the bootstrap values (percentages) based on 1000 replicates, bootstrap values lower than 70% are deleted. Scale bar indicates substitutions per nucleotide position.
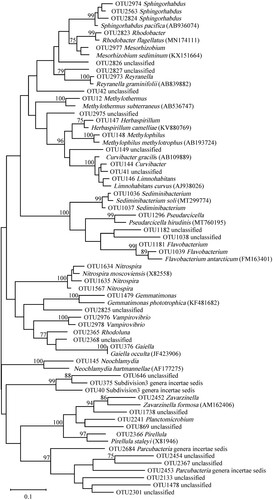
Figure 8. COGs metagenome functional predictions of OTUs from microbiome in the hot spring water.
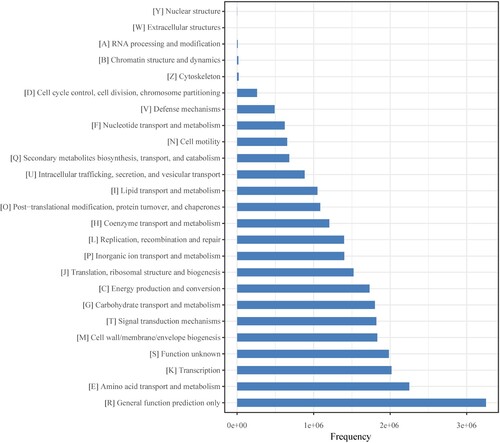
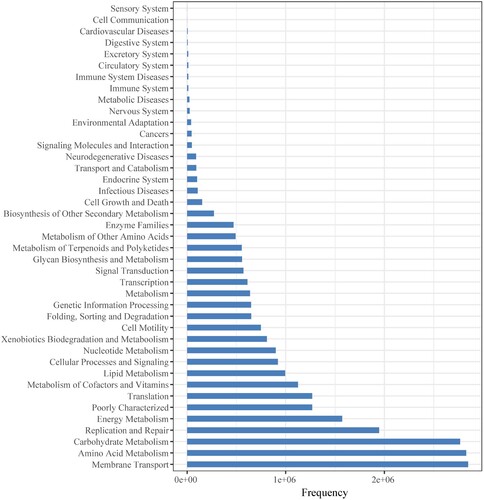
Figure 9. KEGG metagenome functional predictions of OTUs from microbiome in the hot spring water.