
Figures & data
Table 1. Primers sequence of RT-qPCR.
Figure 1. LINC01106 expression is upregulated in NSCLC. (a) LINC01106 expression in squamous cell lung carcinoma was predicted through the bioinformatics website. (b) LINC01106 expression in NSCLC cell lines and normal lung epithelial cell line was detected by RT-qPCR. (c) LINC01106 expression in the cytoplasm and nuclei of A549 cells was verified by RT-qPCR. Repetitions = 3. The results are shown in mean ± standard deviation. One-way ANOVA was used to determine statistical significance. Tukey’s multiple comparisons test was applied for post hoc test. * p < 0.05, ** p < 0.01, *** p < 0.001.
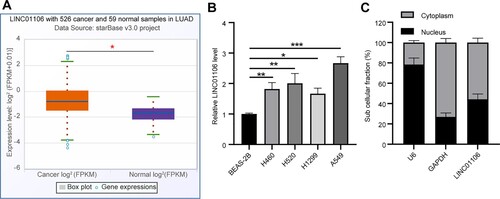
Figure 2. LINC01106 knockdown relieves the malignant phenotype in NSCLC. (a) LINC01106 expression in A549 cells with LINC01106 knockdown was detected by RT-qPCR. (b) A549 cell proliferation after LINC01106 knockdown was accessed by the CCK-8 method. (c and d) A549 cell migration (c) and invasion (d) after LINC01106 knockdown was measured by the Transwell assay. (e and f) levels of EMT markers (e) and their gray value (f) in A549 cell proliferation after LINC01106 knockdown was determined by western blot analysis. Repetitions = 3. The results are shown in mean ± standard deviation. One-way ANOVA was used to determine statistical significance. Tukey’s multiple comparisons test was applied for post hoc test. ** p < 0.01, *** p < 0.001.
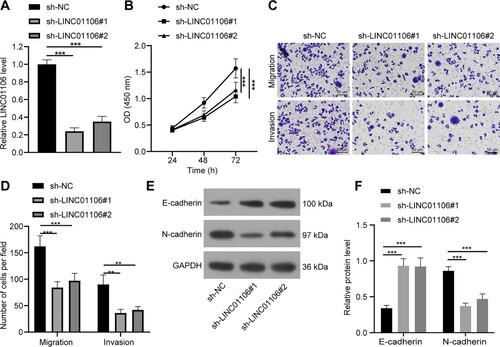
Figure 3. LINC01106 knockdown reduces NSCLC tumor growth in vivo. (a–c) tumor volume growth curve (a), reprehensive images (b) and weight (c) of transplanted tumor sample at the 4th week of nude mice from each group. (d) and E, Ki67 positive expression (d) and positive cell number (e) of nude mice from each group detected IHC. (f), mRNA expression of LINC01106, miR-765 and COL3A1 was determined by RT-qPCR. (g and h) protein levels (g) and gray values (h) of E-cadherin, N-cadherin and COL3A1 in tumor tissues from nude mice of each group. N = 6. The results are shown in mean ± standard deviation. One-way ANOVA was used to determine statistical significance. Tukey’s multiple comparisons test was applied for post hoc test. * p < 0.05, ** p < 0.01, *** p < 0.001.
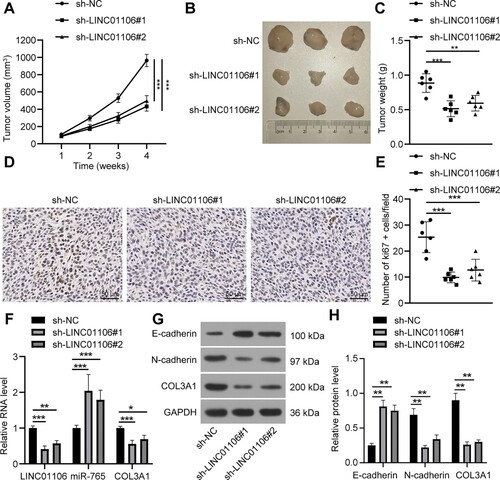
Figure 4. LINC01106 serves as a sponge of miR-765 in NSCLC. (a) there was a potential binding site between LINC01106 and miR-765. (b) The dual-luciferase reporter gene assay was performed as LINC01106-WT or LINC01106-MUT was co-transfected with miR-765 mimic or miR-NC into A549 cells. (c) According to the results of RIP, LINC01106 and the miR-765 enriched induced silencing complex in RNA. (d) miR-765 expression in NSCLC cells and normal lung epithelial cells was detected by RT-qPCR. (e) miR-765 expression in A549 cells with LINC01106 knockdown was measured by RT-qPCR. Repetitions = 3. The results are shown in mean ± standard deviation. The Student’s t-test was used to determine statistical significance. Tukey’s multiple comparisons test was applied for post hoc test. ** p < 0.01, *** p < 0.001.
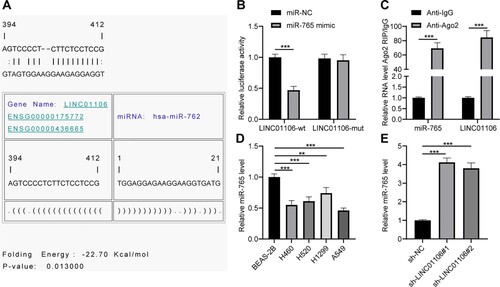
Figure 5. miR-765 overexpression inhibits A549 cell proliferation, migration and invasion. (a) miR-765 expression in A549 cells with miR-765 overexpression was detected by RT-qPCR. (b) A549 cell proliferation after miR-765 overexpression was verified through the CCK-8 method. (c and d) A549 cell migration and invasion (c) and statistical analysis (d) were measured via the Transwell assay. (e and f) levels of EMT markers (e) and their gray value (f) in A549 cell after miR-765 overexpression was accessed by western blot analysis. Repetitions = 3. The results are shown as mean ± standard deviation. Student’s t-test was used to determine statistical significance. ** p < 0.01, *** p < 0.001.
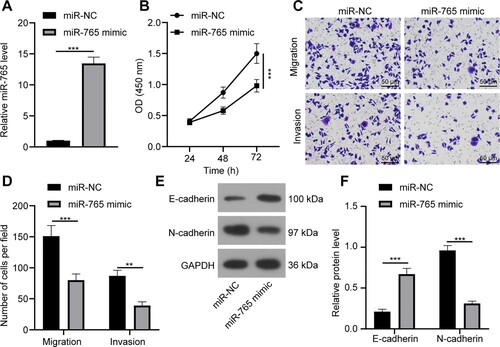
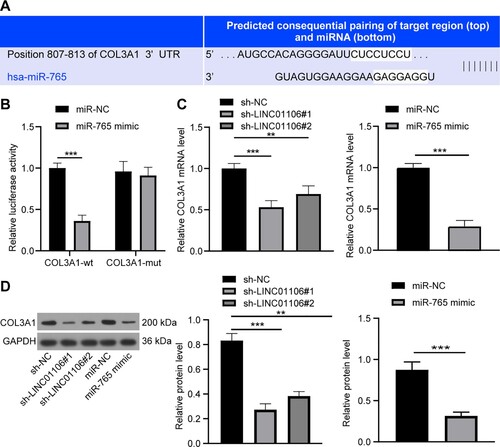
Figure 6. COL3A1 might be a direct target of miR-765. (a) The potential binding sites between COL3A1 3’UTR and miR-765. (b) COL3A1-WT or COL3A1-MUT and miR-765 mimic or miR-NC was co-transfected into A549 cells, and the transfection efficiency of the co-transfection was detected by the dual-luciferase reporter gene assay. (c) mRNA expression of COL3A1 in A549 cells with LINC01106 silencing or miR-765 overexpression was assessed by RT-qPCR. (d) Protein level of COL3A1 in A549 cells with miR-765 overexpression was examined by the western blot analysis. Repetitions = 3. The results are shown as in mean ± standard deviation. Student’s t-test was used to determine statistical significance. Tukey’s multiple comparisons test was applied for post hoc test. * p < 0.05, ** p < 0.01, *** p < 0.001.
Data availability
That data which supports the findings of the present study are available at the figshare repository (https://doi.org/10.6084/m9.figshare.16947475.v4).