
Figures & data
Figure 1. Illustration of somatic mutations in KIRC from TCGA cohort. (A) Waterfall plot illustrates the frequently mutated genes in KIRC from TCGA cohort. The top panel shows mutation frequency. The bottom panel presents mutation types. (B) Interaction plot of the mutated genes from TCGA cohort (C) A summary of the mutated genes in KIRC from TCGA cohort.
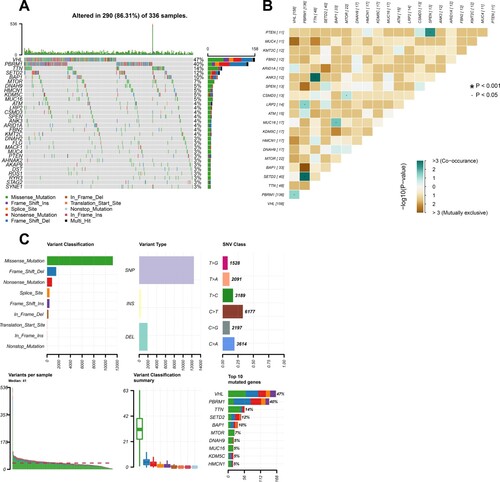
Figure 2. Illustration of somatic mutations in KIRC from ICGC cohort and Venn diagram of frequently mutated genes covered by all the three cohorts. (A) Waterfall plot illustrates the frequently mutated genes in KIRC from ICGC cohort. (B) Venn diagram of the 30 most frequently mutated genes covered by TCGA, ICGC and UTokyo cohorts.
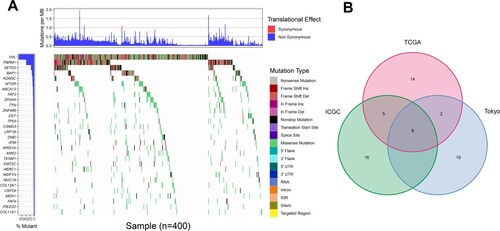
Figure 3. Investigation of gene mutation associated with both TMB and overall survival. (A) Several common mutated genes’ mutation is associated with TMB. (B) Kaplan-Meier survival curves of patients with gene mutations. (n = 336). The log-rank p-value is marked in each graph. (C) Influence of the interaction between BAP1 mutation and MUC16 mutation on the prognosis in KIRC patients.
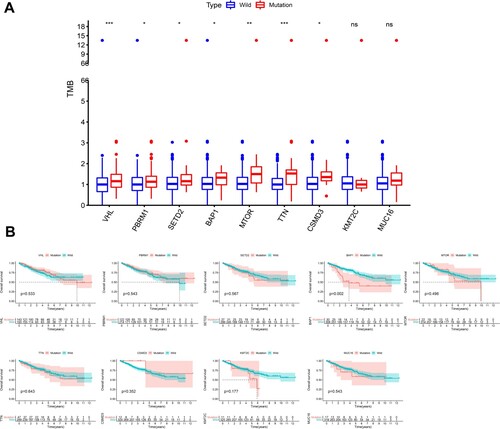
Figure 4. Univariate and multivariate cox regression analysis. Univariate and multivariate overall survival analysis considering age, gender, grade, stage and TMB status in the Cox regression model. The left green one was univariate cox regression and the right red one represented the results of multivariate cox regression.
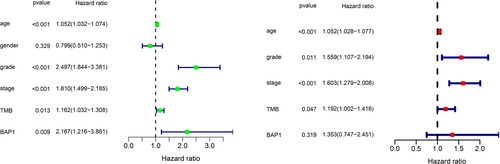
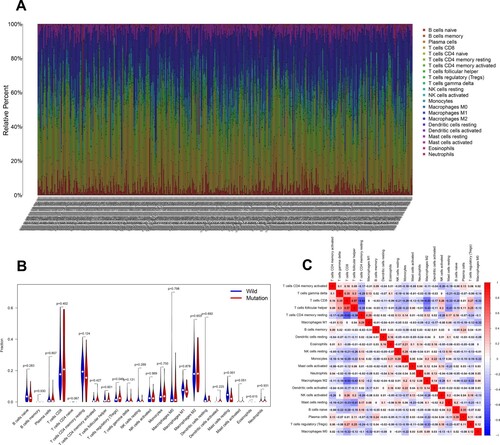
Figure 5. Association between BAP1 mutation and tumor-infiltrating immune cells. (A) Stacked bar chart illustrates distribution of 22 immune cells in each sample. (B) Violin plot shows the differentially infiltrated immune cells between BAP1-mutant groups and BAP1-wild group. (C) Correlation matrix of immune cell proportions. The red color represents positive correlation and the blue color represents negative correlation.
Data availability
The data that support the findings of this study are available in TCGA-portal at http://portal.gdc.cancer.gov/projects (Weinstein et al. Citation2013), ICGC-portal at http://dcc.icgc.org/releases/current/Projects (Zhang et al. Citation2011) and cBioPortal at https://www.cbioportal.org/study/summary?id = ccrcc_utokyo_2013 (Cerami et al. (Citation2012).