
Figures & data
Figure 1. Map of Ethiopia.
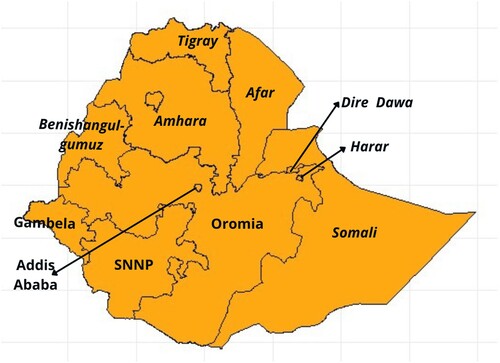
Table 1. Study variables.
Table 2. The fixed effect estimates of the bivariate model.
Figure 2. The probability of excess prevalence of (a) stunting in the presence of underweight, (b) wasting in the presence of stunting, (c) underweight in the presence of stunting, (d) stunting in the presence of wasting, (e) wasting in the presence of underweight, and (f) underweight in the presence of wasting. High probability value signifies strong evidence of malnutrition prevalence that exceeds the country's average prevalence, and consequently, increase in susceptibility of children in the region. (a) Stunting, (b) Wasting
, (c) Underweight
, (d) Stunting
, (e) Wasting
and (f) Underweight
.
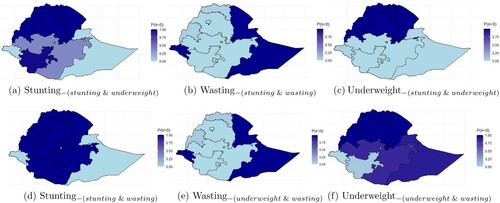
Table 3. Spatial effect estimated from the BCAR model.
Figure 3. The relative change in the prevalence of (a) stunting and underweight, (b) stunting and wasting, (c) wasting and underweight with respect to a child's age, and (d) stunting and underweight, (e) stunting and wasting, (f) wasting and underweight with respect to a mothers' age. A declining curve signifies increasing prevalence, and a rising curve signifies a lowering prevalence.
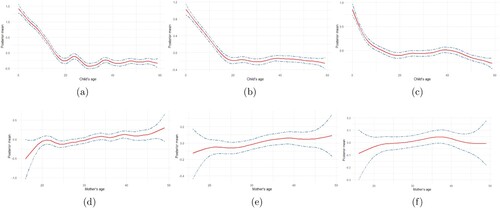
Figure A1. Cluster-specific random intercept of stunting and underweight in Ethiopia. The vertical bars are the credible intervals.
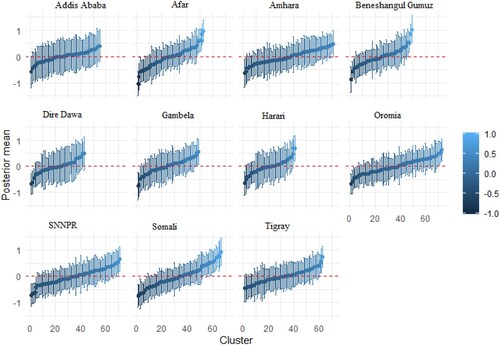
Figure A2. Cluster-specific random intercept of stunting and wasting in Ethiopia. The vertical bars are the credible intervals.
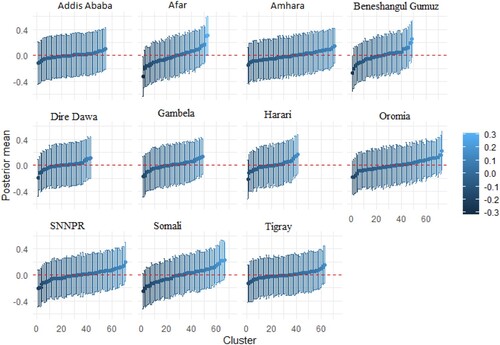
Figure A3. Cluster-specific random intercept of underweight and wasting in Ethiopia. The vertical bars are the credible intervals.
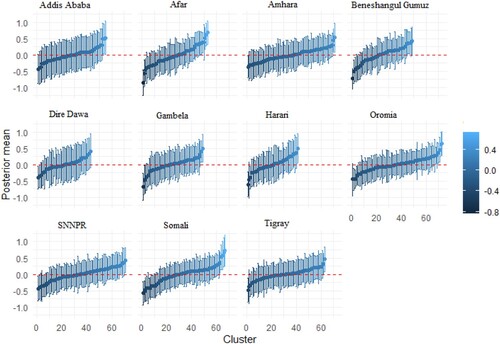
Figure A4. The relative change in the prevalence of stunting with respect to a child's age (a) and mothers' age (b), underweight with respect to a child's age (c) and mothers' age (d) and wasting with respect to a child's age (e) and mothers' age (f).
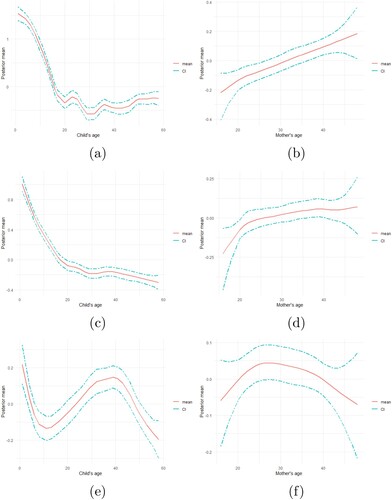
Figure A5. Prevalence of (a) stunting, (d) underweight, (g) wasting, the significance of (b) stunting (e) underweight, (h) wasting, and the probability of high prevalence of (c) stunting, (f) underweight, and (i) wasting. The black portions indicates regions with significant high prevalence and the white portion indicates significant lower prevalence region.
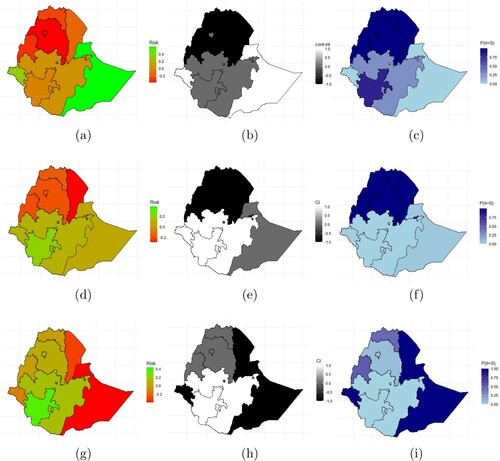
Table C1. Fixed effects estimates of the univariate model.