
Figures & data
Table 1. Important chemical compounds in Jin Ning Fang decoction.
Figure 1. Venn diagram of predicted targets of compounds and lung cancer-related genes.
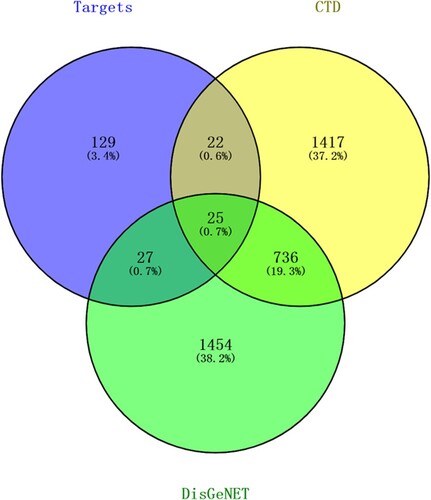
Figure 2. Results of Gene Ontology (GO) functional analysis. A: Histogram. The vertical axis is the GO term, and the horizontal axis is the percentage of genes enriched in each related GO functional term. GO functional grouping is distinguished by the color of the bars. The number on the right of the bar represents the number of genes enriched in each related GO functional term. * P < 0.05, ** P < 0.01. B: Pie chart.
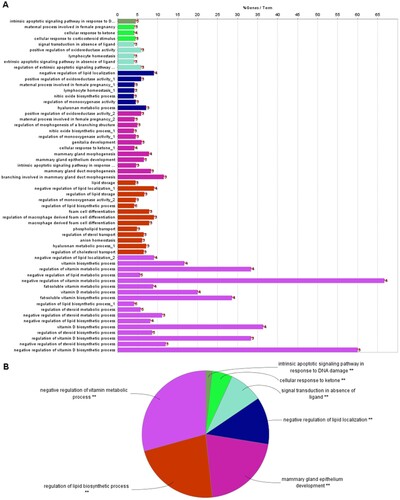
Figure 3. Functional enrichment analysis of 25 targets. A: GO-BP functional network. Larger dots indicate smaller P values. Higher kappa coefficients indicate a stronger term association. B: The Kyoto Encyclopedia of Genes and Genomes (KEGG) pathway analysis for 25 targets. The vertical axis is the path name, and the horizontal axis is the number of enriched genes.
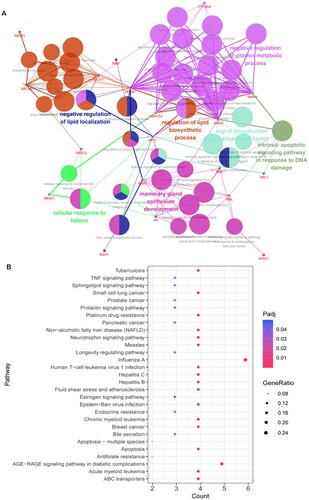
Figure 4. Protein-protein interaction (PPI) network of target proteins. The size of the dots represents the degree of association with other proteins. The larger the dot, the stronger the degree of association.
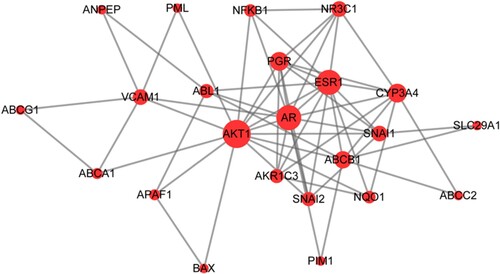
Table 2. Top ten genes in protein-protein interaction (PPI) network.
Figure 5. Pharmacological network. Green diamonds represent herbs, brown squares represent compounds, blue dots represent target genes, red hexagons represent the KEGG pathways, and gray dots represent the targets that are not involved in the pathways.
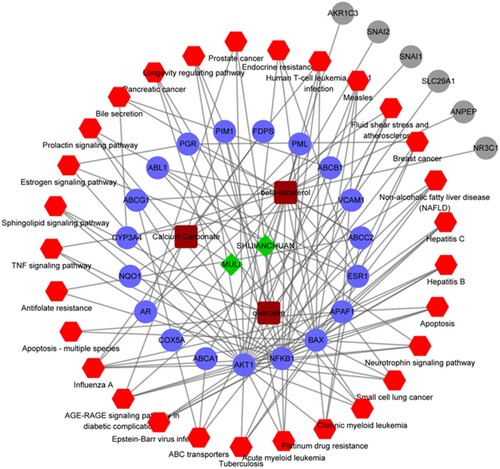
Figure 6. Molecular models of the binding of beta-sitosterol to its predicted protein targets. A: Global map of AKT1-beta-sitosterol molecular docking. Off-white represents the receptor, while the pink ball indicates the small ligand beta-sitosterol. B: Binding interaction between AKT1 and beta-sitosterol. C: Global map of the AR-beta-sitosterol model. D: Binding interaction between AR and beta-sitosterol. E: Global map of the ESR1-beta-sitosterol model. F: Binding interaction between ESR1 and beta-sitosterol.
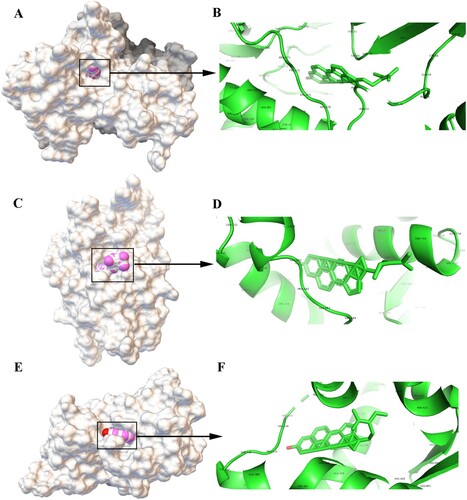
Figure 7. Effect of JNF on the proliferation and apoptosis of lung cancer cells. A: CCK-8 assay was performed to observe cell viability. B: Flow cytometry was used to detect the apoptosis of A549 cells. C: Quantification of living cells and apoptosis cells. Data are presented as mean ± SD. ** P < 0.01.
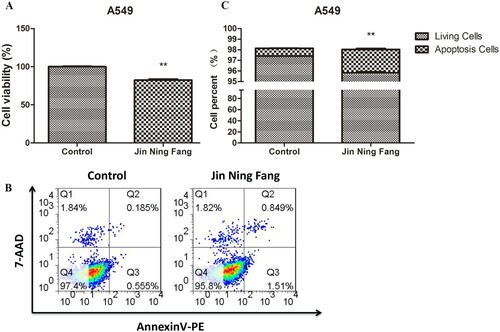
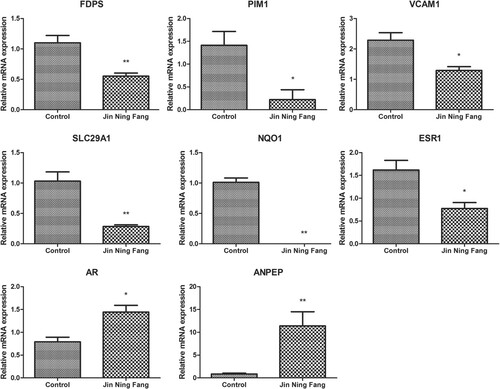
Figure 8. The relative mRNA expression of several genes was determined by qPCR. Data are presented as mean ± SD. * P < 0.05, ** P < 0.01.
Supplemental Material
Download Zip (1.2 MB)Data availability statement
The data analyzed in network pharmacology approach are derived from the following resources available in the public domain: Traditional Chinese Medicine Systems Pharmacology Database (TCMSP, https://tcmsp-e.com/tcmsp.php); Traditional Chinese Medicine Integrated Database (TCMID, http://www.megabionet.org/tcmid/); Bioinformatics Analysis Tool for Molecular Mechanism of Traditional Chinese Medicine (BATMAN-TCM, http://bionet.ncpsb.org/batman-tcm/); Comparative Toxicogenomics Database (CTD, 2018 update, http://ctdbase.org/); and DisGeNET database (https://www.disgenet.org/). The data that support the findings of CCK-8, apoptosis, and qPCR assays are available in 4TU. ResearchData at https://www.doi.org/10.4121/18092750.