
Figures & data
Figure 1. Identification of co-stimulatory molecules clusters. Samples of LUAD and LUSC before (A) and after (B) eliminating batch effect. C, clustering analysis resulted in four clusters based on expression of 12 immune-related prognostic co-stimulatory molecules. D, K–M, Differences in survival of patients in four clusters.
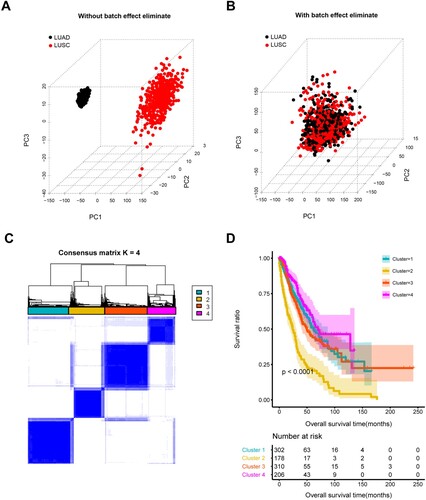
Table 1. Clinical characteristics within these four subtypes.
Figure 2. Functional enrichment analysis. Bar charts show significantly enriched KEGG pathways and top 20 biological processes for feature genes of clusters 1 (A), 2 (B), 3 (C), and 4 (D). Length of bars, gene count in each function terms. Color change from red to blue, P values from low to high.
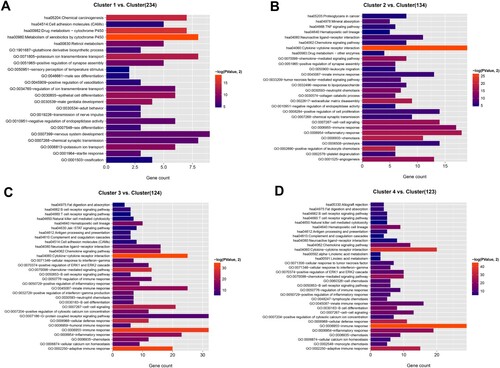
Figure 3. Protein–protein interaction (PPI) network and functional enrichment. A, PPI network of feature genes in four clusters. Node size, degree of each node in network. Bar charts show 20 genes in PPI network that are significantly enriched in biological processes (B) and KEGG pathways (C). Lengths of bars, gene count in each function terms. Color change from red to blue, P values from low to high.
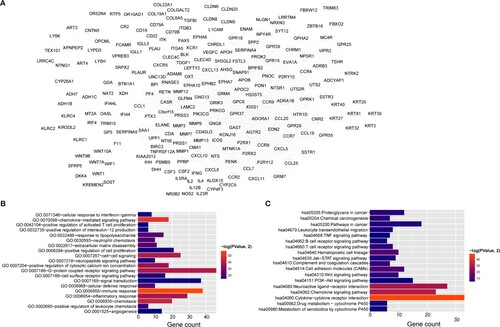
Figure 4. Tumor-infiltrating immune cells differ among clusters. Boxplots show significant differences in tumor-infiltrating memory B cells (A), M2 macrophages (B), regulatory T cells (C), and activated memory CD4+ T cells (D) among four clusters.
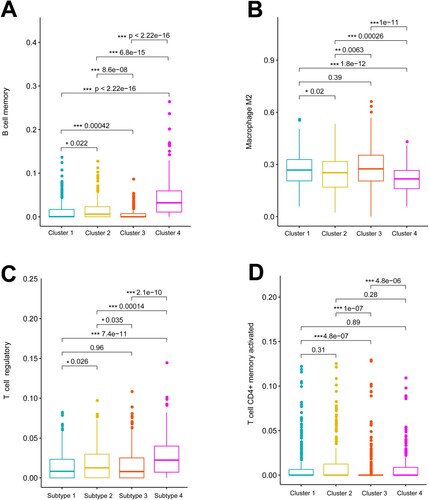
Figure 5. Expression of immune checkpoints genes among clusters. Boxplots shows significant differences in expression of CTLA4 (A), BTLA (B), LAG3 (C), PDCD1 (D), TIGIT (E), and TNFRSF4 (F) among four clusters.
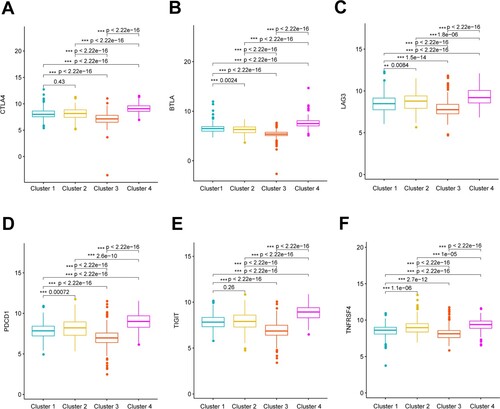
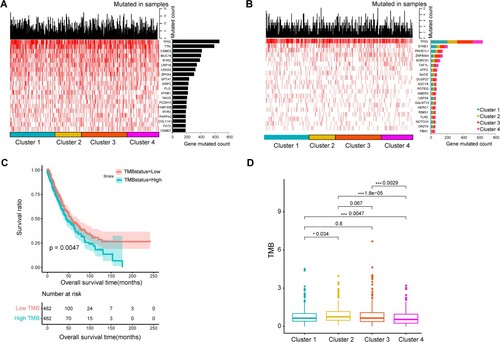
Figure 6. Tumor mutation burden (TMB) and genes with high-frequency mutations among four clusters. A, Top 20 genes ranked by mutation frequency. B, Top 20 genes with significant differences in mutation frequency among four clusters, C, K–M Survival curves of patients with high and low TMB. D, significant differences in TMB among four clusters.
Supplemental Material
Download Zip (2.5 MB)Data availability statement
The data that support the findings of this study are available in The Cancer Genome Atlas (TCGA) database at https://gdc-portal.nci.nih.gov/, including the standardized log (FPKM+1, 2) expression data, clinical phenotype and mutation data of lung adenocarcinoma (TCGA-LUAD) and lung squamous carcinoma (TCGA-LUSC).