
Figures & data
Figure 1. Maize plants infected with MLN, showing the various symptoms observed. Photo taken by Faith Njeru at farmers’ field in Kenya.
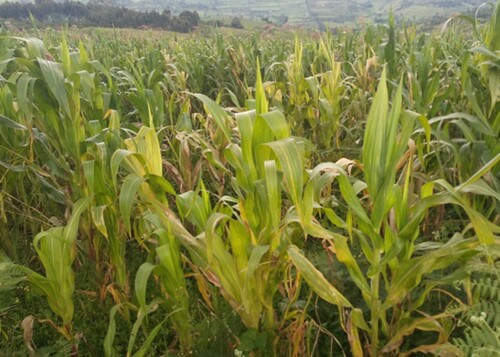
Table 1. Profile of sample farmers.
Table 2. Maize production practices for 2021.
Table 3. Percent of farmers knowing and having observed MLN in their farms.
Table 4. Perceived yield loss due to MLN in different counties of Kenya.
Figure 2. Correlation between level of weeds in the farm, number of times of weeding per season and mean MLN scores of randomly selected maize plants in the farm (MLN mean scores of 25 maize plants in each farm. Correlogram plotted in R studio: https://www.R-project.org/. (More intense colours for more extreme correlations)).
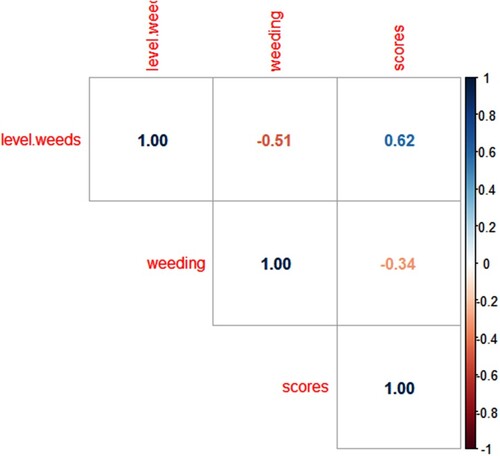
Figure 3. Methods used to control MLN by farmers in the study counties.
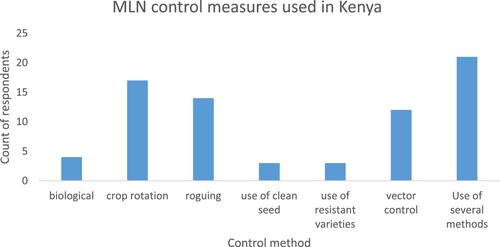
Figure 4. Map showing severity (A) and incidence (B) of MLN in 4 study counties.
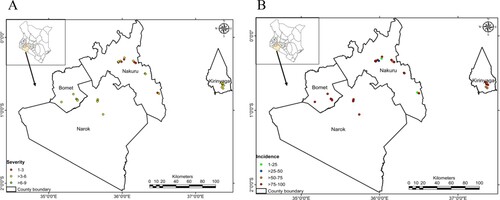
Table 5. MLN severity analysis, incidence and prevalence. The difference in the mean level of severity among the different counties was statistically not significant at α = 0.05 (F-Value = 0.863, P-value = 0.4446).
Figure 5. Results of MCMV and SCMV on a 2% agarose gel: total RNA was extracted from the samples collected from farmers’ field, cDNA was then prepared followed by RT-PCR for MCMV and SCMV using specific primers for these viruses.
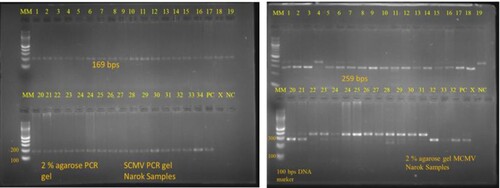
Table 6. MLN viruses testing results using RT-PCR for MCMV and SCMV.
Figure 6. Phylogenetic relationships among SCMV coat protein genes of isolates determined in this study (SCMVKirinyaga, SCMVBomet, SCMVNarok) and those retrieved from GenBank (accession number and geographic region is given). The evolutionary history was inferred by using the Maximum Likelihood method and Jukes-Cantor model. Evolutionary analyses were conducted in MEGA X.
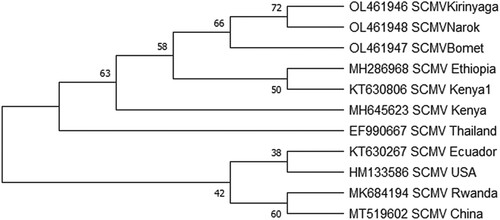
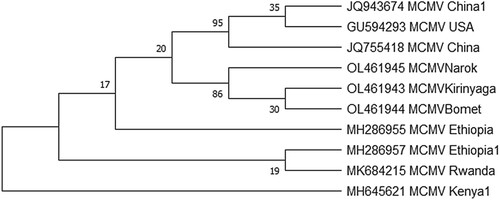
Figure 7. Phylogenetic tree reconstructed based on coat protein genes of isolates determined in these study (OL461945, OL461943, OL461944) and those retrieved from the GenBank: The evolutionary history was inferred using the Maximum Likelihood method based on the Jukes-Cantor model at 1000 bootstraps. GenBank accession numbers and country of origin are indicated.
Supplemental Material
Download PDF (141.7 KB)Data availability statement
The authors confirm that the data supporting the findings of this study are available in the manuscript, and within the articles referenced and their supplementary materials. The raw data used for analysis is found at: njeru, faith (2021), ‘Maize production systems, farmers’ perception and current status of Maize Lethal Necrosis in selected counties in Kenya’, Mendeley Data, V2: https://doi.org/10.17632/n5cpfr4536.2. The raw data that has been deposited include the MLN survey data, the QGIS raw data, the sequencing raw data and the unprocessed RT-PCR gel images which are in the folder named new folder.
The partial coat protein gene sequences of 6 samples in this study were registered in GenBank(https://www.ncbi.nlm.nih.gov) and the accession numbers for MCMV (OL461943, OL461944, and OL461945); SCMV (OL461946, OL461947, and OL461948) were provided.