
Figures & data
Figure 1. The framework of the study.
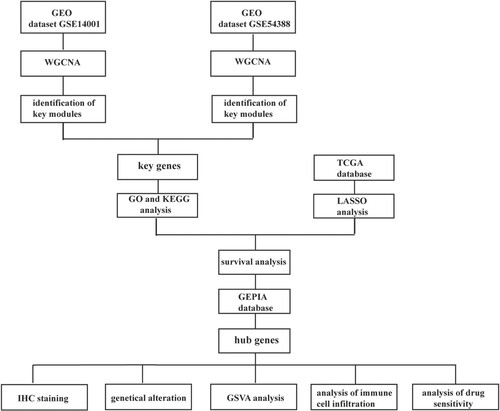
Figure 2. (A) Clustering dendrogram of 23 samples from GSE14001. (B) Analysis of the scale-free fit index for various soft-thresholding powers (β). (C) Analysis of the mean connectivity for various soft-thresholding powers. (D) Dendrogram of the differentially expressed genes clustered together based on a dissimilarity measure (1-TOM), along with the assigned merged module colors and the original module colors. (E) Heatmap of the correlation between the modules and clinical traits of ovarian cancer; red represents positive correlation and blue represents negative correlation. (F) Scatter plot of GS vs. MM in the green module.
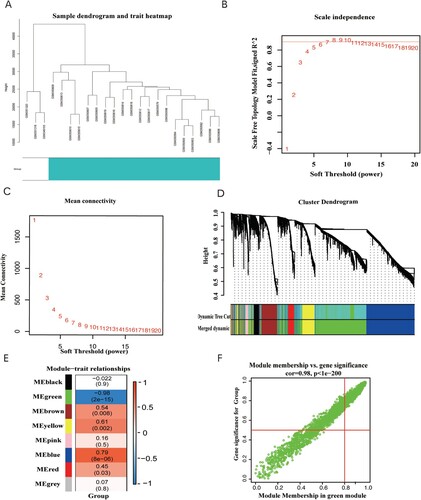
Figure 3. (A) Clustering dendrogram of 22 samples from GSE54388. (B) Analysis of the scale-free fit index for various soft-thresholding powers (β). (C) Analysis of the mean connectivity for various soft-thresholding powers. (D) Dendrogram of the differentially expressed genes clustered together based on a dissimilarity measure (1-TOM), along with the assigned merged module colors and the original module colors. (E) Heatmap of the correlation between the modules and clinical traits of ovarian cancer; red represents positive correlation and blue represents negative correlation. (F) Scatter plot of GS vs. MM in the blue module.
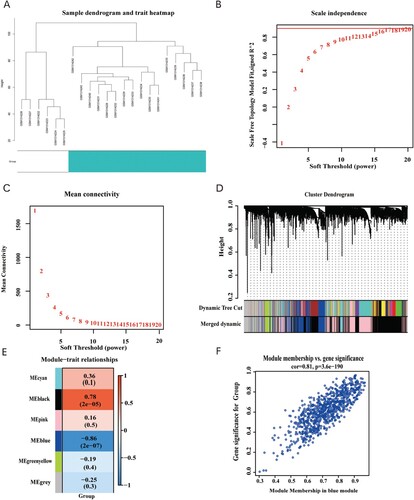
Figure 4. (A) Venn diagram of the intersection of genes in key modules. (B) Protein-protein interaction (PPI) network of 177 key genes. (C) GO analysis of key genes. (D) KEGG enrichment analysis of key genes.
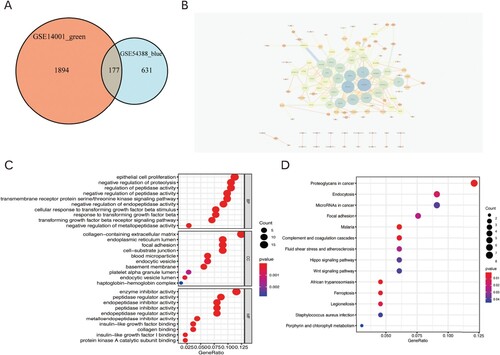
Figure 5. (A) Selection process of the cross-validation parameter (λ). (B) Dynamic-process of the LASSO screening variable.
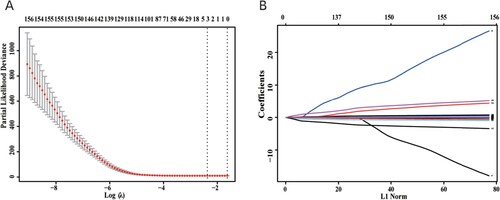
Figure 6. Relationship between the expression levels of (A) CCDC80, (B) FBXO16, and (C) SNX7 with the overall survival of patients with OC; red indicates high expression and black indicates low expression (log-rank P < 0.05). Comparison of the expression of (D) CCDC80, (E) FBXO16, and (F) SNX7 in OC tissues and normal healthy tissues; red indicates tumorous tissues and grey indicates normal tissues. CCDC80 was significantly downregulated, while FBXO16 was significantly upregulated in OV tissues compared to the expressions in normal tissues (P < 0.01). SNX7 was upregulated in OV tissues, but the difference was not significant (P > 0.05). The red asterisk (*) represents the level of significance at P < 0.01.
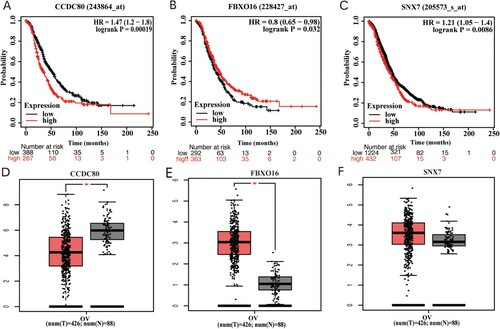
Figure 7. (A) Representative Immunohistochemical photographs stained with CCDC80 and FBXO16 in ovarian cancer tissues and normal ovarian tissues (B) The IHC staining score of CCDC80 in ovarian cancer tissues compared to the scores in normal ovarian tissues (P<0.05). (C) The IHC staining score of FBXO16 in ovarian cancer tissues compared to the scores in normal ovarian tissues (P<0.05).
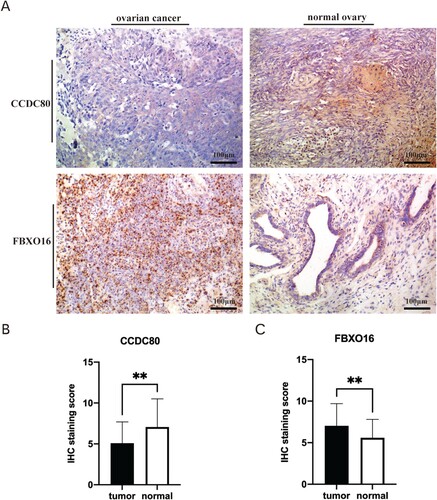
Figure 8. Kaplan-Meier overall survival analyses for CCDC80 and FBXO16 expressed in 60 patients with OC.
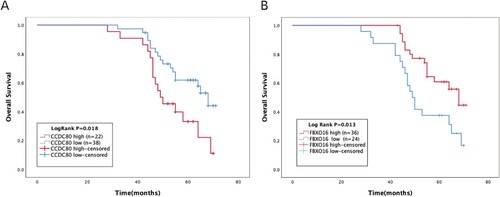
Table 1. Association Between CCDC80/FBXO16 Expression and Clinicopathological Parameters in 60 Patients with Ovarian Cancer.
Figure 9. (A) Mutation rate of hub genes: CCDC80 (9%), FBXO16 (12%). GSVA enrichment pathway diagram of hub genes: (B) CCDC80 and (C) FBXO16.
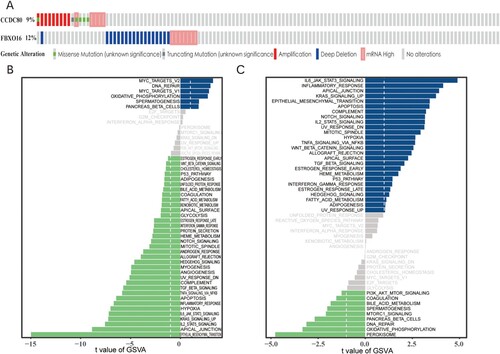
Figure 10. Correlation between infiltrating immune cells and hub genes: (A) CCDC80 and (B) FBXO16; dot size represents the strength of the correlation between genes and immune cells – larger dots denote stronger correlation, and smaller dots denote weaker correlation. The greener the color, the lower the p-value.
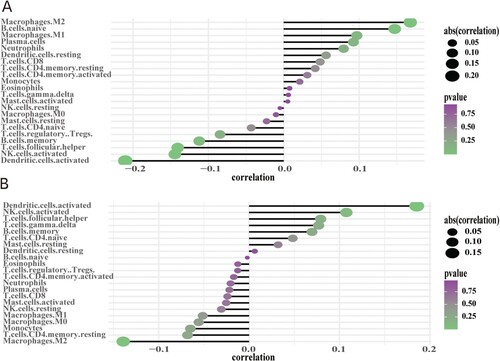
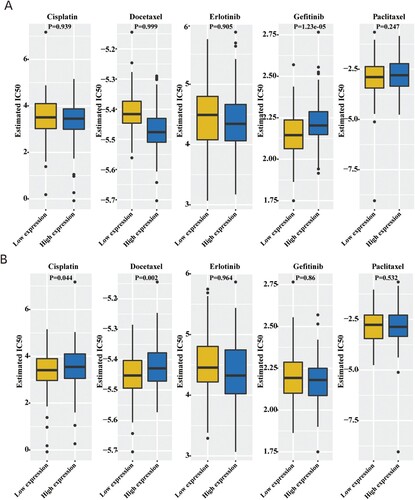
Figure 11. Relationship between the IC50 value of chemotherapeutic drugs and hub genes: (A) CCDC80 and (B) FBXO16.
Data availability statement
These data were derived from the following resources available in the public domain: TCGA with cancer type of ovarian cancer (https://tcga-data.nci.nih.gov/tcga/), and GEO database with Series ID of GSE14001 and GSE54388 (https://www.ncbi.nlm.nih.gov/geo/). The data that support the findings of this study are available in the data repository of Mendeley Data at doi: 10.17632/mtjvvmmmcw.2 (https://data.mendeley.com/datasets/mtjvvmmmcw/2).