
Figures & data
Table 1. Primers used in RT-PCR.
Table 2. Univariate Cox analysis of costimulatory molecule genes in TCGA Cohort of PAAD.
Figure 1. Identification of the costimulatory molecule-based signature (CMS). The distribution of risk score, survival status, and the five-gene expression panel (A). Area under the curve (AUC) curves of different models (B).
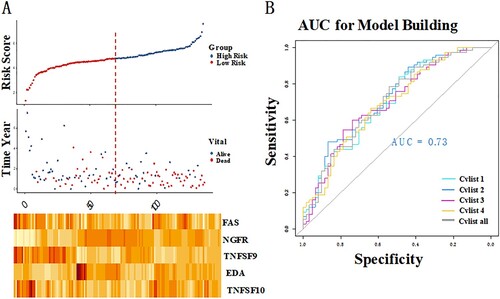
Figure 2. Reverse Transcription-Polymerase Chain Reaction (RT-PCR) used to detect the differential expression of five significant correlation genes in PAAD tissue samples and paracancer tissue samples. **P < 0.01 and ***P < 0.001.
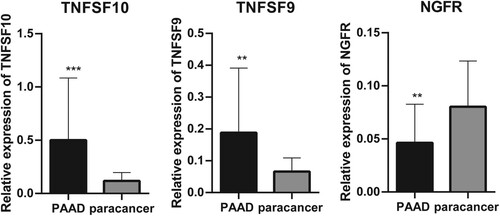
Table 3. The result of model construction (4-fold cross validation).
Figure 3. Kaplan–Meier curve analysis. The overall survival rate in the high- and low-risk groups of the subgroup, with total patients (A), female patients (B), male patients (C), patients with age ≥ 60 (D), patients with age < 60 (E) and patients at early stage (F), were estimated based on the risk score.
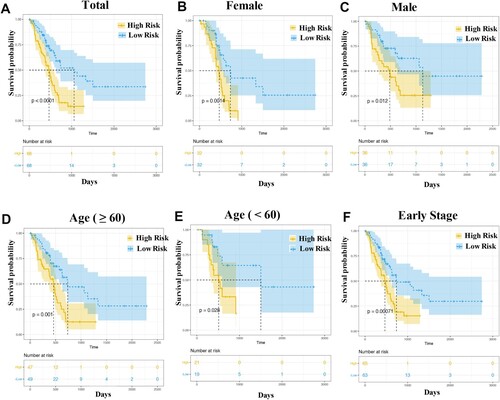
Figure 4. Evaluation of the value of CMS. Survival analysis in both total samples (A), valid samples (B), and GSE57495 dataset (C). The proportional-hazards assumption of the nomogram model (C). The area under the curve (AUC) of genes in model and previous studies (E).
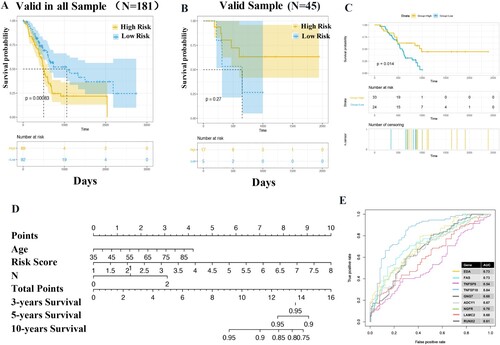
Table 4. Univariable and multivariable Cox regression analysis of the costimulatory molecule-based signature and survival in TCGA dataset.
Figure 5. Differential gene expression analysis in CMS. Principal component analysis described the transcriptome distribution of the sample as a whole (A). Volcano plot of differentially expressed genes (B). GO and KEGG analyses of the highly expressed genes (C) and lowly expressed genes (D). The number of DEGs is shown on the X axis, while GO terms or KEGG pathway terms are shown on the Y axis.
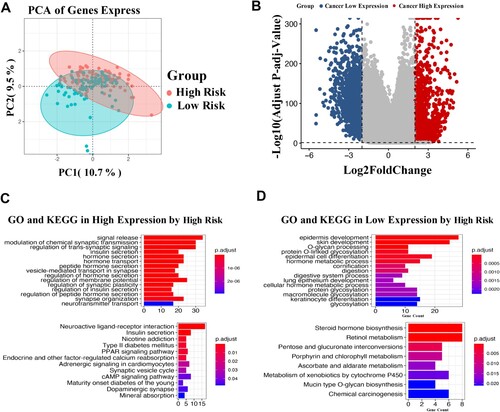
Figure 6. CMS-related immune cell infiltration and inflammatory activities. The average proportion of immune cells in the samples (A). Significant differences in the proportion of three immune cells between high- and low-risk patients (B). *P < 0.05 and **P < 0.01.
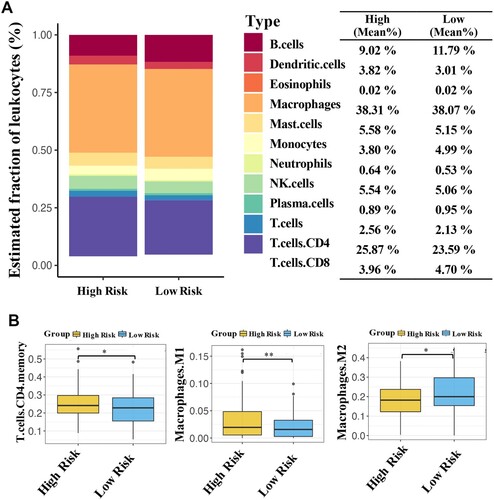
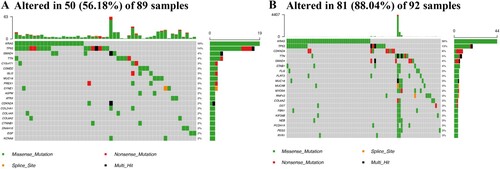
Figure 7. CMS-related somatic mutation. The mutant genes in the low- (A) and high-risk groups (B).
Supplemental Material
Download TIFF Image (1.3 MB)Data availability statement
The data that support the findings of this study are available in UCSC Xena of TCGA database at http://xena.ucsc.edu, reference (Zweig et al. Citation2008), as well as GSE57495 dataset in GEO database at https://www.ncbi.nlm.nih.gov/geo/query/acc.cgi?acc=GSE57495 (doi: 10.1371/journal.pone.0133562), and the raw data of RT–PCR are available at https://figshare.com/s/9de1b322ce2af8fa3b84.