
Figures & data
Figure 1. Viral CPE (Vero cells seeded at 5 × 10⁴ cells/well with SARS-CoV-2 5th passage log10 dilutions). Each of the samples was performed in the well-plate at four repeats. After 4 days in culture, 96 well plates were fixed and stained with formaldehyde and crystal violet, respectively. Plates were washed in water, dried, and scanned. The end-point titers (TCID50) were calculated according to the Reed & Muench method based on four replicates for titration
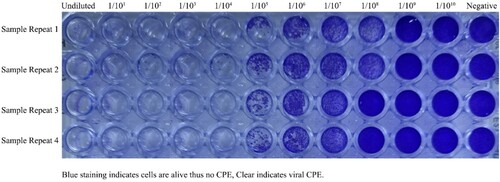
Figure 2. Propagation of SARS-CoV-2 in VERO CCL-81 cell culture. A. Healthy and confluent Vero cells in T-175 Flasks. B. 62. h after the inoculation of SARS-CoV-2 in T-175 Flasks. C. Healthy and confluent Vero cells on Cytodex-1 microcarriers in Biostat RM 20L Bioreactor. D. 62. h after the inoculation of SARS-CoV-2 on Cytodex-1 microcarriers in Biostat RM 20L Bioreactor.
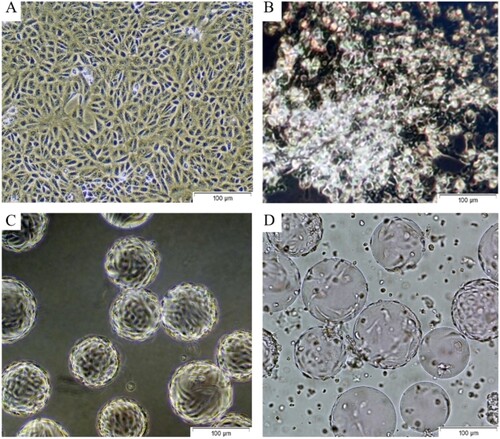
Table 1. SARS-COV-2 Spike protein quantities
Figure 3. Quantification of SARS-CoV-2 in CCL-81 cell culture. Plaque assays were performed on the harvested virus at 62 h post-infection, fixed, and stained with crystal violet to visualize. A, B, C, D, E wells are ten-fold dilutions of virus (10−3–10−7) and F well is the negative control.
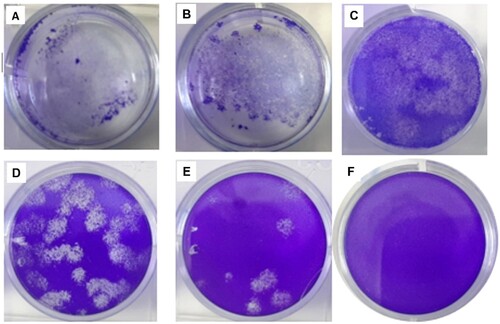
Figure 4. Viral kinetics of the KOCAK-19 strain at different MOIs. A. Growth kinetics titers as a PFU/ml B. Growth kinetics titers as a TCID50/ml
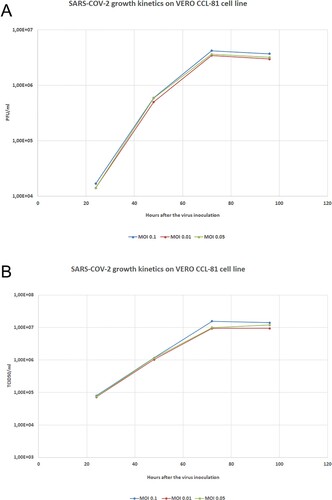
Figure 5. qRT-PCR results for SARS-COV-2 harvest samples cultivated in Vero CCL-81 cell line.
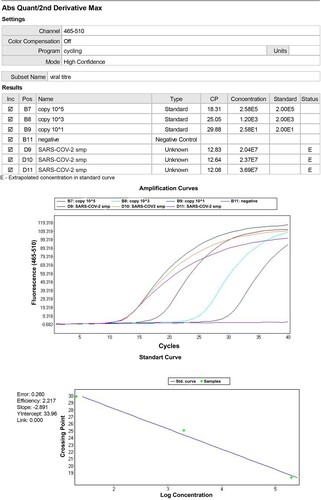
Figure 6. 25 µl loading volume of KOCAK-19 SARS-CoV-2 final bulk SDS gel electrophoresis against known BSA (150 and, 250 ng/25µl) standards
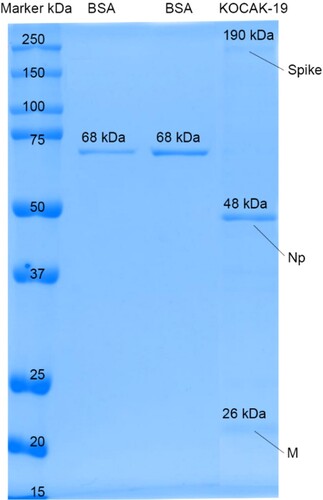
Figure 7. A. SARS-COV-2 Spike bands, approx.190 kDa B. Nucleoprotein bands, approx. 48 kDa in Western Blotting
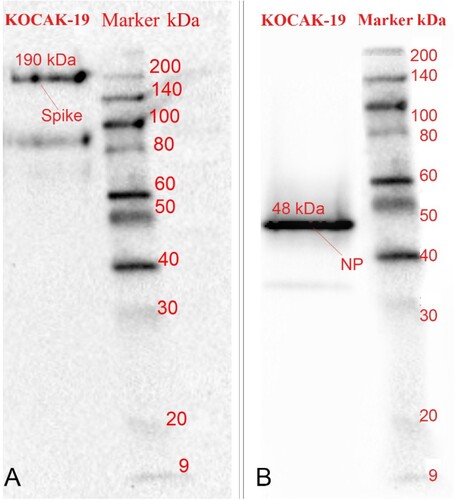
Figure 8. A. Negative stain transmission electron microscope (TEM) images of SARS-CoV-2 virus particles in a Vero cell vesicle at different magnifications. B. TEM images of oval-shaped particles with diameters of 90–110 nm of the virus after the final purification step at different magnifications.
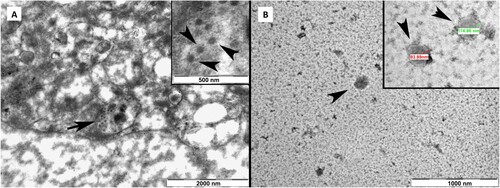
Figure 9. Mouse neutralization antibody (NAb) levels with different doses by two-dose immunization. Mice were injected intraperitoneally (IP) route by using two-time immunization (D0/D21), and the NAb levels 35 days after the first immunization were tested by the microneutralization method (n = 10).
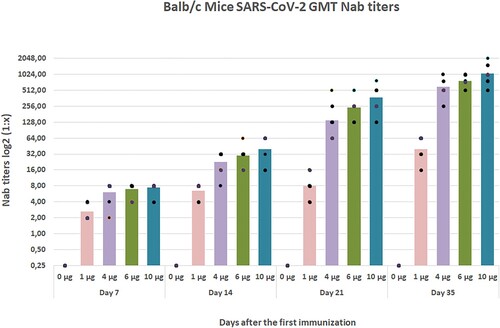
Figure 10. Microneutralization analysis of Balb/c mice Nab(s) was carried out in 96 well plates coated by Vero CCL-81 cells. The assay was performed on 0,7,21, and 35 days after the first immunization, neutralized by 100 TCID50 SARS-CoV-2 viruses, incubated for 4 days, fixed, and stained with crystal violet to visualize. The first 10 well columns belong to two-fold dilutions of Nab, the 11th well columns are the negative control, and the 12th well columns are positive virus controls. Each of the samples was performed in the well-plate at four repeat
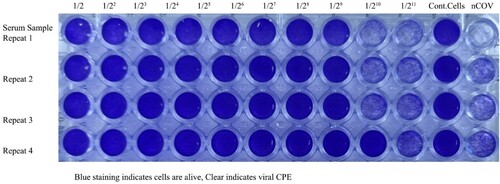
Figure 11. The ELISPOT assay was performed on 35th days after the first immunization in three Balb/c mice (each of 3 animals).
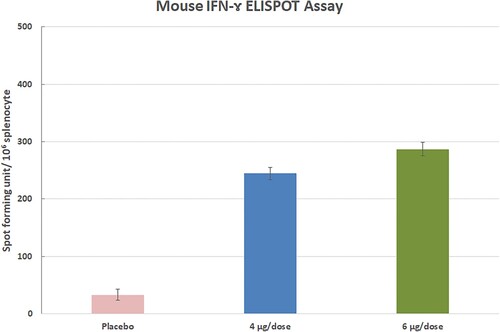
Figure 12. K-18 hACE 2 transgenic mice placebo, 4µg, and 6 µg groups (each of 10 animals) mean weight changing graphs. Five animals in the placebo group died at 5–7 dpi. No any symptoms in both of the vaccinated groups
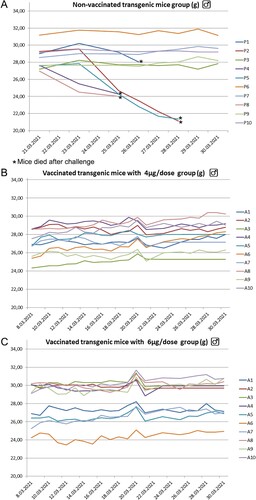
Figure 13. Viral loads were performed using SARS-CoV-2 qRT- PCR 3rd days following the challenge in three K-18 hACE transgenic mice (each of 3 animals).
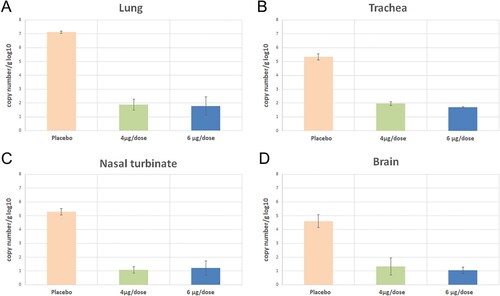
Figure 14. A. Hematological parameters in control and 8 µg doses vaccinated ferrets B. Biochemical parameters in control and 8 µg doses vaccinated ferrets after the end of the 2 months of the first injection
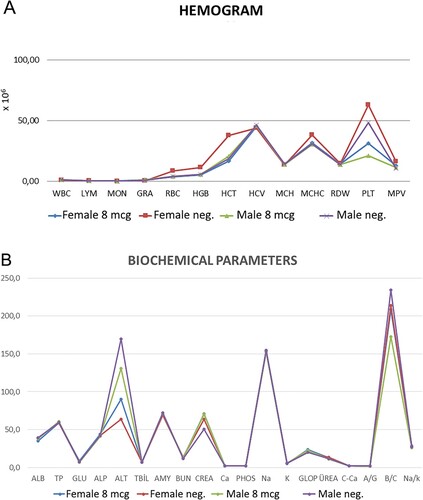
Figure 15. Mean weight gain percentage of Balb/c mice vaccinated with different doses of vaccine candidate during to two months. Error bars represent ± standard deviation.
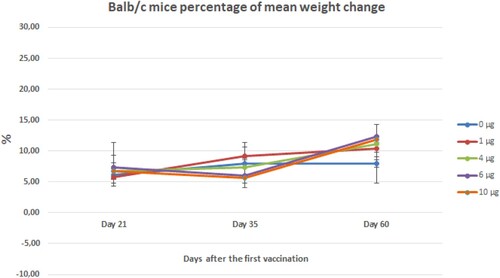
Table 2. Histopathologic changes observed in animals
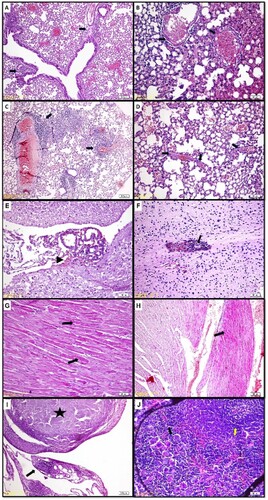
Figure 16. A) Changes in the lungs. Hematoxylin-eosin, G1-1, Perivascular and peribronchial lymphocytic infiltrations (arrow). B) Changes in the lungs. Hematoxylin-eosin, G1-4, Fibrinoid necrosis in the small vessels (arrow). C) Changes in the lungs. Hematoxylin-eosin, G2-3, Hyperemia, and perivascular lymphocytic infiltrations (arrow). D) Changes in the lungs. Hematoxylin-eosin, G4-2, Thrombosis in small vessels (arrow). E) Changes in the central nervous system. Hematoxylin-eosin, G2-4, Per diapedesis bleeding in the meninges (arrowhead). F) Changes in the central nervous system. Hematoxylin-eosin, G2-3, Perivascular lymphoid infiltrations, and micro thrombosis (arrow). G) Changes in the heart. Hematoxylin-eosin, G2-2, Widespread Zenker degenerations (arrow) H) Changes in the heart. Hematoxylin-eosin, G2-1, Widespread Zenker degenerations (arrow). I) Changes in the abdominal fat tissue. Hematoxylin-eosin, G4-4 Granulomatous changes; lymphocytic infiltrations, macrophages, and small necrosis (arrow). Wide calcified necrosis in a granuloma (star). J) Changes in the spleen. Hematoxylin-eosin, G2-2, Lymphocytic hyperplasia throughout the spleen (yellow arrow) and increased megakaryocytes (black arrow).
Data Availability Statement
The raw data that support the findings of this study are available on http://doi.org/10.11922/sciencedb.o00025.00001 in Science Data Bank.