
Figures & data
Figure 1. Karyotype, FISH, and bone marrow analysis during the appearance of the extra chromosome Y. (A) The karyotype analysis showed 47,XY,+Y. (B) FISH analysis showed that the centromere of Y (red signals) was copied while the centromere of X (green signals) was normal. (C) Bone marrow aspirate smear analysis showed slight dysplasia of the erythroid cells.
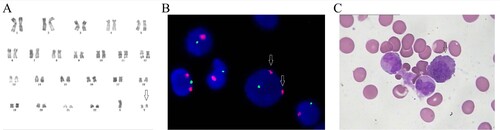
Table 1. Genetic and survival summary of the reported cases of chromosome abnormalities after auto-HSCT for AML.
Supplemental material
Supplemental Material
Download MS Word (29.2 KB)Data availability statement
The data that support the findings of this study are available in the figshare repository at https://doi.org/10.6084/m9.figshare.19233795.