
Figures & data
Figure 1. Research model illustrating the hypothetical influence of technology acceptance factors on intentions to use BSFL in fish farming.
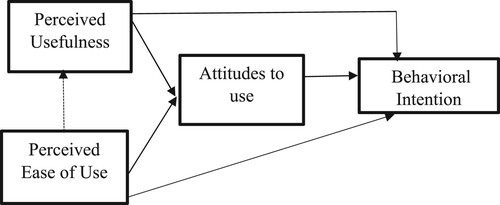
Table 1. Distribution of respondents by farmer category per county.
Table 2. Fish Farmer Socio-economic profile for categorical variables.
Table 3. Fish Farmer Socio-economic profile for continuous variables.
Figure 2. Indicator loadings and path coefficients of key behavioral constructs.
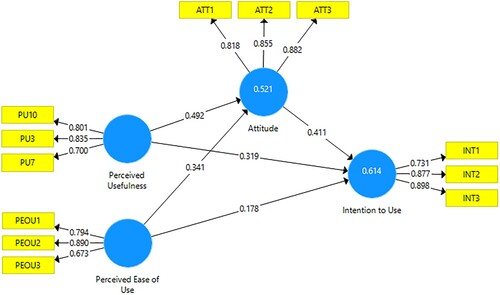
Table 4. Internal consistency: Cronbach's Alpha, composite reliability, and average variance extracted.
Table 5. Fornell-Larcker criterion analysis for checking discriminant validity.
Table 6. Heterotrait-Monotrait (HTMT) criterion.
Figure 3. Bootstrapping results showing t-statistics.
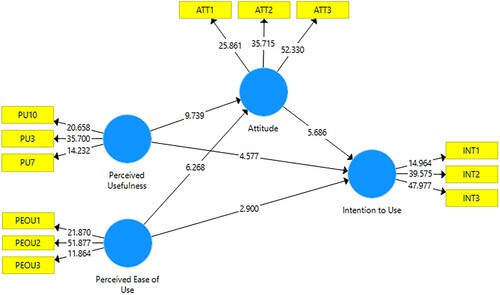
Table 7. Results of path coefficients and hypothesis testing, n = 211.
Table A1. Latent variables, indicator ID and the corresponding questionnaire statements used within the survey.
Table A2. Test for common method bias.
Table A3. Variance inflation factor (VIF) values.
Table A4. Outer loadings (factor loadings).
Data availability
The data that support the findings of this study are openly available in Figshare at https://doi.org/10.6084/m9.figshare.19739023.