
Figures & data
Table 1. Descriptive statistics of RNA-seq data.
Figure 1. Identification of the Differentially Expressed Genes. A) Volcano plots of differentially expressed genes (DEGs) between the cancer tissues and the para-cancerous scar tissues. The red and green dots indicate the significantly upregulated and downregulated genes, respectively. B) Hierarchical clustering analysis of the DEGs. AB represents the MU tumor tissue samples, while ZC represents the matched para-cancerous scar tissues.
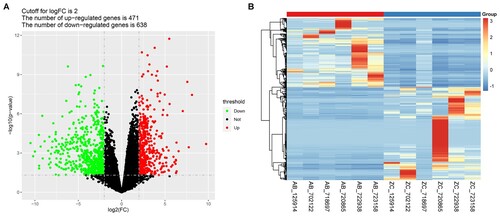
Figure 2. Functional enrichment analysis of the DEGs. A) The top 10 enriched biological processes terms; B) The top 10 enriched cellular component terms; C) The top 10 enriched molecular function terms; D) The top 10 enriched KEGG pathways. The x-axis indicates the number of DEGs, and the y-axis represents the enriched pathways. The adjusted p-value was represented by the color key on the right.
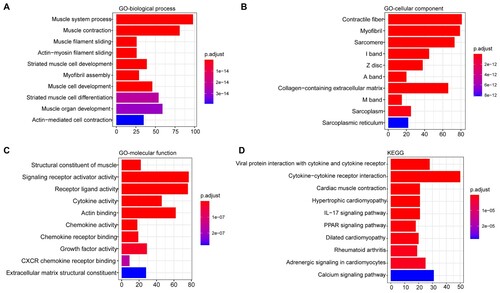
Table 2. The significant enriched top 5 positively and negatively correlated KEGG pathways in GSEA.
Figure 3. Identification of key pathways and DEGs. A) GSEA enrichment score curves of the four common pathways. The top panel shows the enrichment scores of each pathway. The middle vertical bars display the position of each hit. The bottom panel indicates the ranking metric scores. B) Protein-protein interactions between the important pathways and genes. The different pathways are represented by different big light color ellipses and the hub genes are represented by the small dark color ellipses. The grey lines indicated the associations between the hub genes.
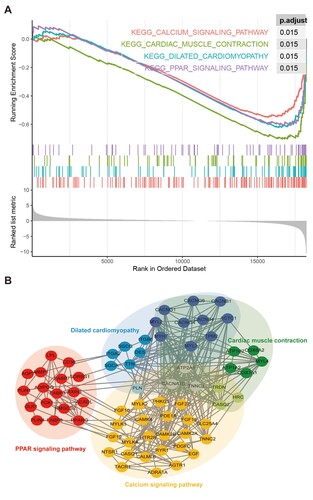
Figure 4. Identification of key pathways and DEGs. A) The diagram of the PPAR signalling pathway. B) The heat map of the DEGs in the PPAR signalling pathway. AB represents the MU tumor tissue samples, while ZC represents the matched para-cancerous scar tissues.
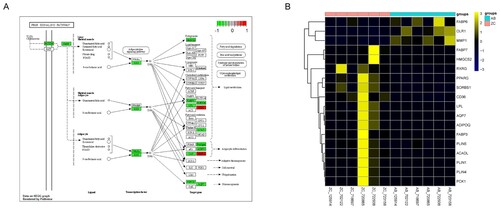
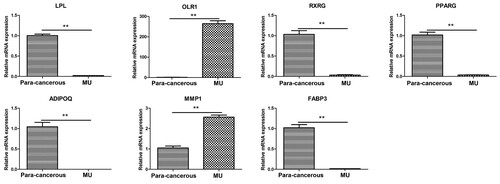
Figure 5. qRT-PCR analysis of the hub genes in the PPAR signalling pathway. GAPDH was used as the reference gene. ** indicates that the gene expression was significantly different between the MU and the para-cancerous scar tissues (p <0.01).
Data availability statement
The raw sequencing data used in this study were deposited in the National Center for Biotechnology Information (NCBI) Sequence ReadArchive (SRA) database with accession number PRJNA821549 (http://www.ncbi.nlm.nih.gov/bioproject/821549). The data for RT-qPCR has been uploaded to 4TU. ResearchData repositories with doi:10.4121/19375049 (https://figshare.com/s/fa15a0a8ef60ee34f0e8).