
Figures & data
Table 1. Overview of datasets.
Figure 1. Flowchart of patient selection and study design.
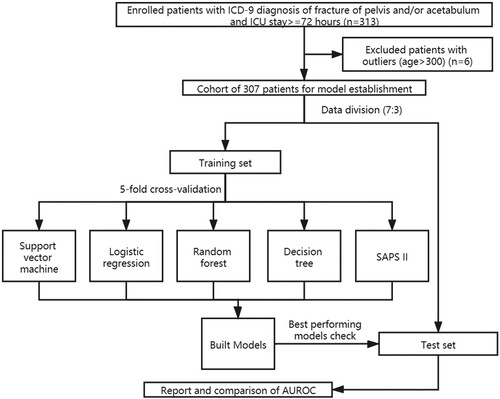
Figure 2. Distributions of the characteristics in the survivors and non-survivors. (a) Gender distribution; (b) Admission type distribution.
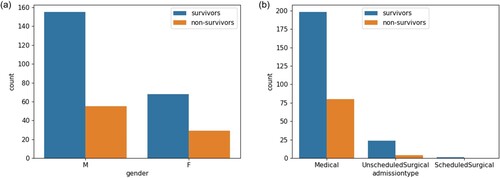
Figure 3. Distributions of selected variables in the survivors and non-survivors. (a) Age distribution. (b) SAPS II score distribution. SD = Standard deviation.
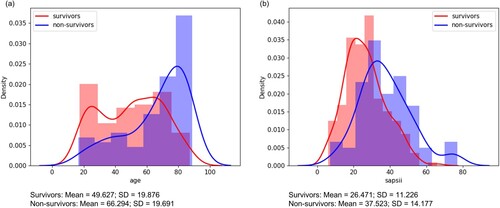
Table 2. First-24 hours characteristics of enrolled patients with pelvis and/or acetabulum fractures in MIMIC-III.
Table 3. Comparison of customized mortality prediction models with SAPS II.
Figure 4. Receiver-operating characteristics (ROC) curves of customized machine learning models. LR = logistic regression; DT = decision tree; RF = random forest.
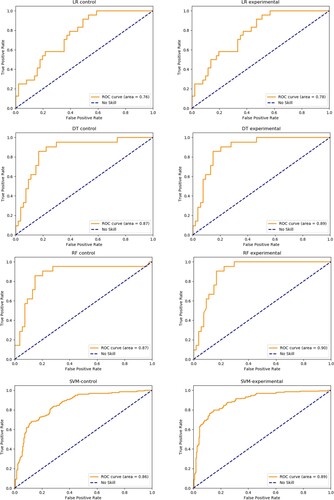
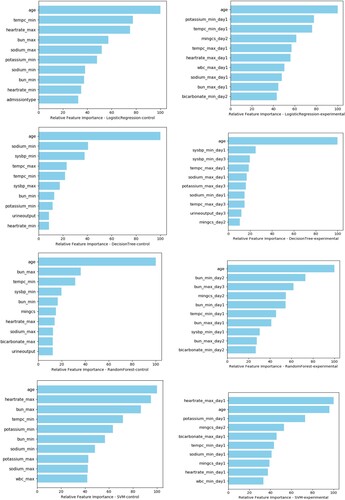
Figure 5. Feature importance of customized machine learning models.
Data availability statement
All the data utilized in our research came from the MIMIC-III database, developed by The Laboratory of Computational Physiology at the Massachusetts Institute of Technology (MIT), which can be accessed from the official website: https://mimic.physionet.org/ (Johnson et al. Citation2016). The final datasets for this project are freely and openly accessed on the Science Data Bank under (http://www.dx.doi.org/10.11922/sciencedb.00787) (Cai Citation2021). Please see Table and reference list for details and link to the data. The original codes are open to be required for other researchers.