
Figures & data
Table 1. Standard regression models generated by GenStat to characterize stem rust progress in eight wheat cultivars with different resistance levels and sowing times at plot scale.
Table 2. Average, standard deviation, and range values detected for predictors of stem rust progress in wheat cultivars with different resistance levels and sowing times at plot scale.
Figure 1. Wheat stem rust severity curves during 2013–2014 (up) and 2015–2016 (down) growing seasons in resistant (Baharan and Pishtaz), semi-resistant (Pishgam and Sirwan) and susceptible (Bahar, Chamran II, Parsi and Sivand) cultivars sown at different dates (x axis represents assessment times).
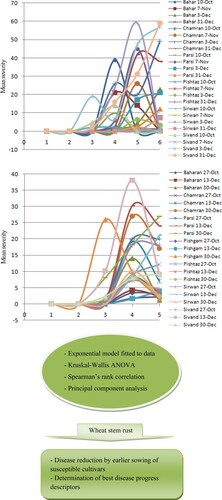
Table 3. Effects of cultivar resistance and sowing time on wheat stem rust progress curve elements examined by Kruskal-Wallis one-way ANOVA based on H-test.
Table 4. Spearman’s rank correlations between wheat stem rust progress curve elements determined for eight cultivars with different resistance levels and sowing times at plot scale.
Table 5. Principal component analysis of stem rust progress curve elements characterized for wheat cultivars with different resistance levels and sowing times at plot scale.
Data availability statement
The data that support the findings of this study are openly available in figshare at https://doi.org/10.6084/m9.figshare.20487651.