
Figures & data
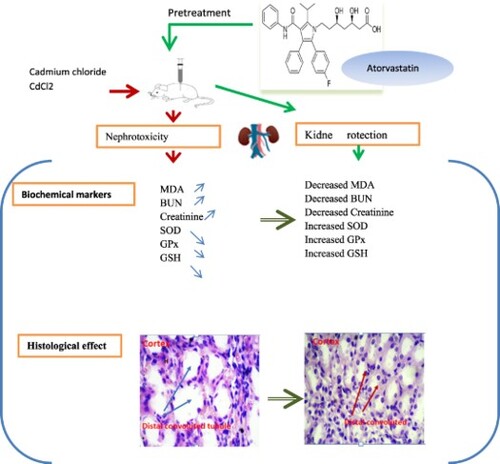
Figure 1. The time schedule for experimental rat treatments.
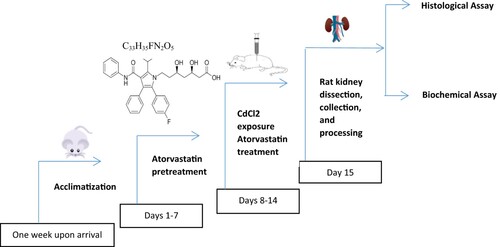
Figure 2. Effects of AT on MDA levels in kidney tissues of rats treated with CdCl2 at the dosages of 1, 2, and 3 mg/kg. Administration of CdCl2 (2 and 3 mg/kg) significantly increased levels of MDA in serum compared to the rats received saline. Pretreatment with AT decreased the effect of CdCl2 (3 mg/kg). Presented figures are mean ± S.E.M (n = 7) 0.05999. *P < .05, **P < .01.
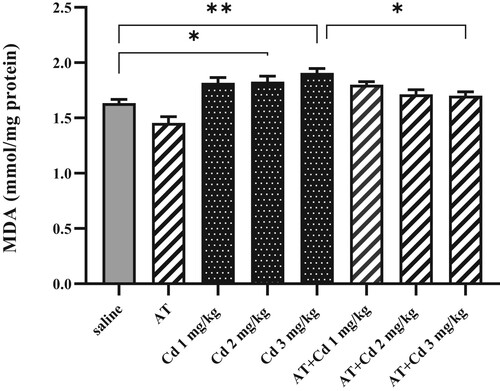
Figure 3. (a). Effects of AT on GSH levels in kidney of rats received CdCl2 (1, 2, and 3 mg/kg). Administration of CdCl2 (3 mg/kg) significantly lowered the content of GSH. Pretreatment of AT significantly suppressed the CdCl2-induced effects of 2 and 3 mg/kg doses. Values are mean ± S.E.M (n = 7) 0.7959. *P < .05, **P < .01. (b). Effects of AT on SOD activity in the kidney tissues of rats received CdCl2 (1, 2, and 3 mg/kg). CdCl2 (3 mg/kg) significantly decreased the content of SOD compared to the saline-treated rats. AT pretreatment improved SOD at the level of the control group and significantly suppressed the effect of CdCl2 (1 mg/kg). Results are mean ± S.E.M (n = 7) 0.4352. *P < .05, **P < .01.3.2.3. Glutathione peroxidase (GPx). (c). Effects of AT on GPx activity in renal tissues of rats received CdCl2 with doses of 1, 2, and 3 mg/kg. Data showed no significant difference in GPx levels between rats pretreated with AT and the rats received the various doses of CdCl2. Results are mean ± S.E.M (n = 7) 0.7233. **P = .0078, *P = .0138.
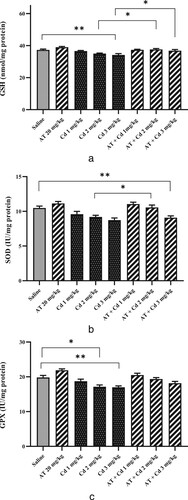
Figure 4. Effects of AT on BUN concentrations in the rats exposed to CdCl2 with doses 1,2, and 3 mg/kg. Administration of CdCl2 (3 mg/kg) significantly increased the level of BUN. AT pretreatment significantly decreased BUN compared to saline and CdCl2-treated rats (1 and, 3 mg/kg). Figures are mean ± S.E.M (n = 7) (0.8043). Saline and AT ***P = .0009, CdCl2 3 mg/kg and saline **P = .0015, CdCl2 1 mg/kg and AT + CdCl2 1 mg/kg *P = .0123, CdCl2 3 mg/kg and AT + CdCl2 3 mg/kg *P = .0378.
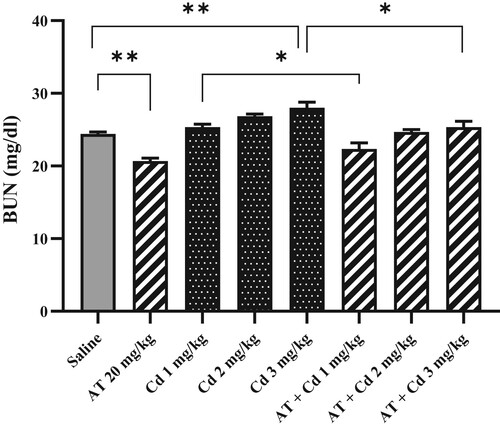
Figure 5. Effects of AT on creatinine in rat kidney tissues exposed to CdCl2. Administration of CdCl2 (3 mg/kg), induced significant increase in creatinine level compared to the rats treated with saline and AT pretreatment significantly decreased creatinine and the effect of CdCl2 (1, 2 and 3 mg/kg) . Results are presented as mean ± S.E.M (n = 7) 0.1018. *P < .02, **P < .01.
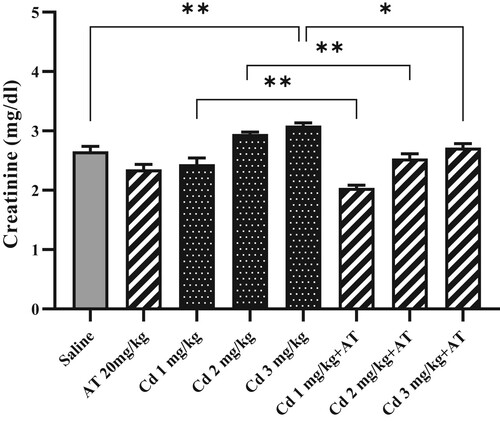
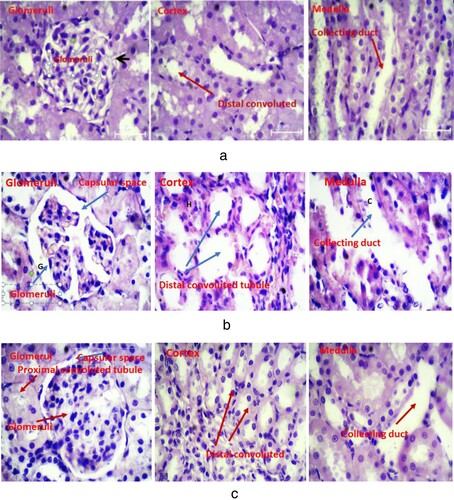
Figure 6. (a). Light microscopy of rat renal tissue of the control group under normal saline treatment illustrating the healthy architecture of Bowman’s capsule (black arrow), glomeruli, distal tubules, and collector duct. (b). Light microscopy of rat kidney received CdCl2 (3 mg/kg) displaying renal damages: degeneration of glomeruli (G), hemorrhage (H), deposited epithelial cells in collector duct (C). (c). Light microscopy of rat kidney structure following pretreatment of AT (20 mg/kg) 30 min before administration of CdCl2. AT protective effect on CdCl2- induced kidney damage, exhibiting normal kidney tissue structure with glomeruli, renal distal convoluted, and collecting duct.
Data availability statement
Data supporting reported results in this study can be found at https://data.mendeley.com/datasets/fknzy9twbz/5.