
Figures & data
Figure 1. Flow chart of our study.
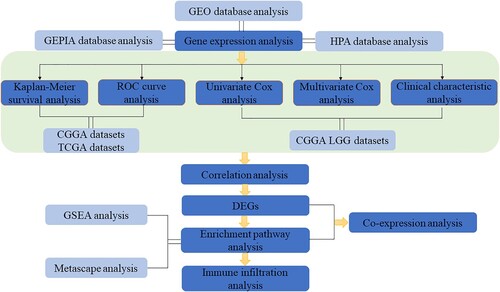
Figure 2. Differential expression of GNG5 in different database. GNG5 expression in glioma (A), LGG (B), and GBM (C) patients in GSE4290. GNG5 expression in glioma (D), LGG (E) and GBM (F) patients in GSE50161. GNG5 expression in glioma (G), LGG (H) and GBM (I) patients in GSE66354. (J) GNG5 expression in LGG and GBM patients by using online GEPIA. (K) The protein level of GNG5 in normal tissue by using online HPA website (staining: medium; intensity: moderate; quantity: >75%). (L) The protein level of GNG5 in LGG tissue by using online HPA website (staining: high; intensity: strong; quantity: >75%). Results of immunohistochemical staining of glioma with WHO grade II (M-P) and WHO grade III (Q-T).
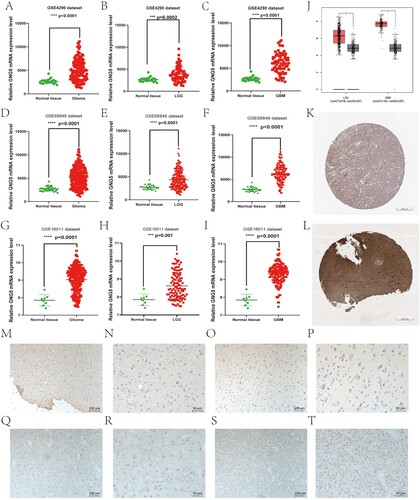
Figure 3. Survival analysis and prognostic ability of GNG5 in different database. Survival analysis in glioma (A), LGG (B) and GBM (C) patients from the CGGA database. Survival analysis in glioma (D), LGG (E) and GBM (F) patients from the TCGA database. ROC curve analysis in glioma (G), LGG (H) and GBM (I) patients from the CGGA database. ROC curve analysis in glioma (J), LGG (K) and GBM (L) patients from the TCGA database.
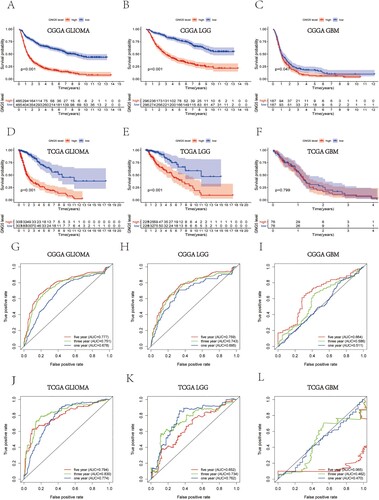
Figure 4. Independent prognosis analysis of GNG5 in the CGGA database. Univariate analysis (A) and multivariate analysis (B) of GNG5 in LGG patients.
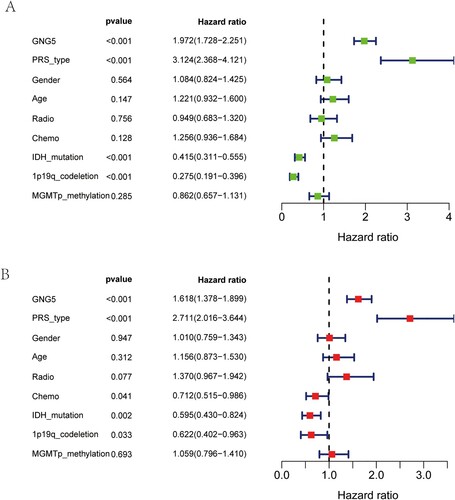
Figure 5. The association between the expression level of GNG5 and clinical characteristics. CGGA database: (A) Grade; (B) PRS type; (C) 1p19q co-deletion status; (D) IDH mutation status; (E) Histology. TCGA database: (F) Age; (G) Grade; (H) Gender; (I) Histological subtypes; (J) TP53 mutation status.
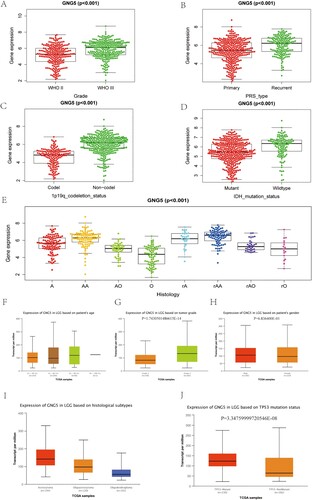
Table 1. Expression of GNG5 in LGG based on patients’ age.
Table 2. Expression of GNG5 in LGG based on histological subtypes.
Figure 6. Enrichment pathway analysis and co-expression analysis of GNG5. (A) Metascape analysis. (B) GSEA analysis. (C) Heatmap of the top 20 genes positively and negatively correlated with GNG5. (D) Venn diagram of DEGs and the complement and coagulation cascades pathway. (E) A circular plot of the 9 intersection genes.
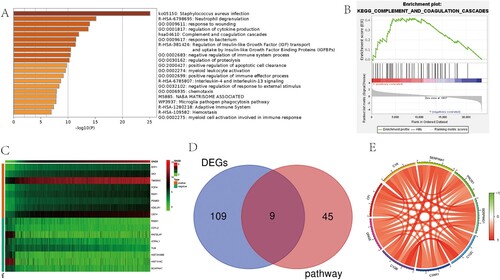
Table 3. Correlation between GNG5 and the 9 intersecting genes.
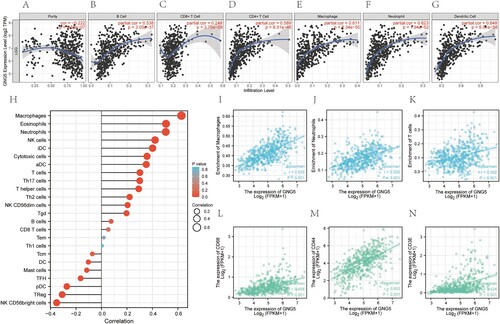
Figure 7. Immune infiltration analysis of GNG5. (A-G). Relationship between the expression level of GNG5 and Purity (A), B cell (B), CD8+ T cell (C), CD4+ T cell (D), Macrophage (E), Neutrophil (F), Dendritic Cell (G) of LGG patients using Timer multiple algorithms. (H). Correlations between the expression of GNG5 and various immune cells based on ssGSEA analysis. (I-K). Correlation analysis of the expression of GNG5 with the common immune cells derived from the above two algorithms. (I). Macrophages. (J). Neutrophils. (K). T cells. (L-N). Correlations between the expression of GNG5 and the corresponding markers of common immune cells. (L). CD68. (M). CD44. (N). CD3E.
Data availability statement
The data that support the findings of this study are available in [Gene Expression Omnibus (GEO)] at [https://www.ncbi.nlm.nih.gov/geo], reference (Barrett et al. Citation2013), [The Chinese Glioma Genome Atlas (CGGA)] at [http://www.cgga.org.cn/], reference (Zhao et al. Citation2021), [The Cancer Genome Atlas (TCGA)] at [https://portal.gdc.cancer,gov/repository], reference (Wang et al. Citation2016), [Gene Expression Profiling Interactive Analysis (GEPIA)] at [http://gepia.cancer-pku.cn/], reference (Tang et al. Citation2017), [The Human Protein Atlas (HPA)] at [http://www.proteinatlas.org], reference (Thul and Lindskog Citation2018), [Ualcan] at [http://ualcan.path.uab.edu.], reference (Chandrashekar et al. Citation2017), [Metascape] at [http://metascape.org/gp/index.html#/main/step1], reference (Zhou et al. 2019), [Tumor Immune Estimation Resource(TIMER)] at [http://timer.cistrome.org], reference (Li et al. Citation2020). The raw data that support the immunohistochemical staining experiment of this study are available in figshare at https://doi.org/10.6084/m9.figshare.19682871.