
Figures & data
Figure 1. Location map of Amhara Regional State in Ethiopia (left) and Lake Tana (right).
Source: Authors' production using Ethio-Gis spatial data, 2021.
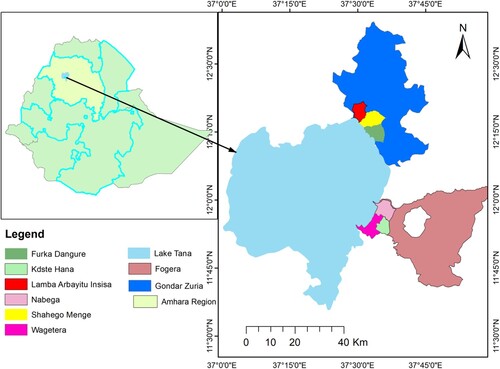
Table 1. Description of the Sentinel 2 MSI satellite images.
Figure 2. Agricultural land adjacent to Lake Tana (left) and nutrient load under the weed (right).
Source: Images taken during the field survey, 2021.
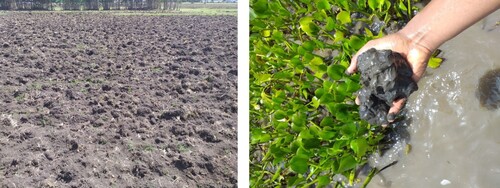
Table 2. Spatial coverage of water hyacinth in Lake Tana.
Figure 3. NDVI analysis of Lake Tana in dry (left) and wet (right) seasons.
Source: NDVI output, 2021.
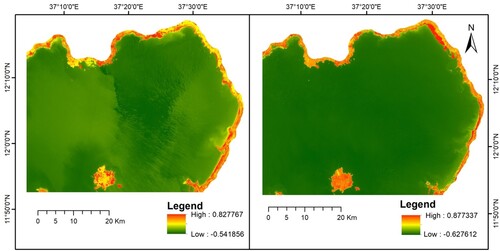
Figure 4. Spatial coverage of water hyacinth in dry (left) and wet (right) seasons of 2021.
Source: MLC output, 2021.
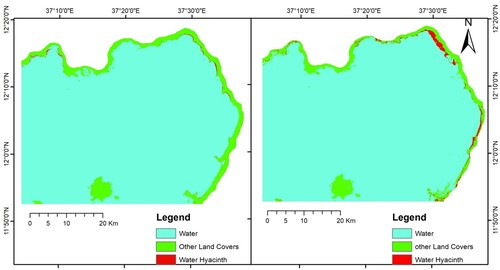
Figure 5. Overall accuracy and Kappa value for the wet and dry seasons of 2021.
Source: Authors’ compilation, 2021.
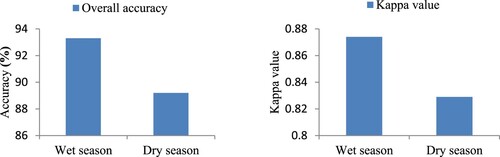
Table 3. Morphometric measurements of water hyacinth in Lake Tana (n = 36).
Figure 6. Water hyacinth invasion around Lake Tana.
Source: Images taken during the field survey, 2021.
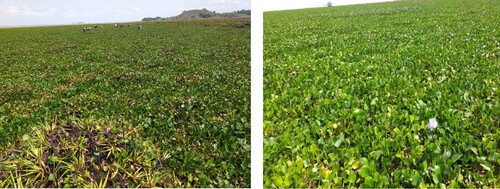
Table 4. Lake Tana water hyacinth biomass in tons (n = 36).