
Figures & data
Figure 1. IgA1 increased cell proliferation and the levels of IL-1β and NLRP3 in HMCs. (A) HMCs were stimulated with different concentrations of IgA1 (0, 50, 100, 250, 500, and 1000 µg/mL). Cell proliferation was measured by CCK-8 assay. (B) The production of IL-1β was detected by ELISA after treatment with IgA1 (0, 100, 250, and 500 µg/mL). (C, D) The expression level of NLRP3 was detected by qPCR (C) and Western blot (D) after treatment with IgA1 (0, 100, 250, and 500 µg/mL). *P < 0.05; **P < 0.01; ***P < 0.001 vs. 0 µg/mL of IgA1.
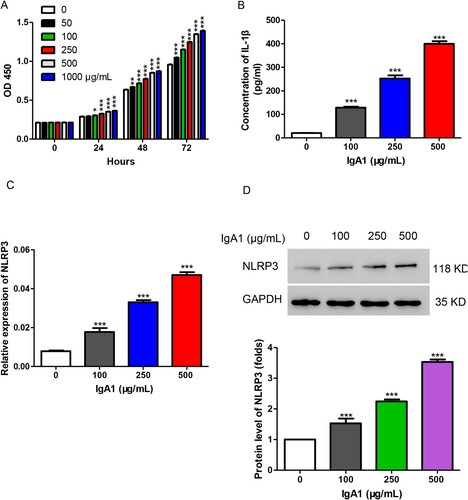
Figure 2. GB suppressed proinflammatory cytokine production in IgAN cell model. (A) HMCs were treated with 250 µg/mL of IgA1 and different concentrations of GB (0.01, 0.02, 0.05, 0.1, and 0.2 mg/mL). Cell proliferation was measured by CCK-8 assay. (B) HMCs were treated with 250 µg/mL of IgA1 together with different concentrations of GB (0.02, 0.05, and 0.1 mg/mL) or MCC950 (1 µM). Cell proliferation was measured by CCK-8 assay. (C) The production of IL-1β was detected by ELISA after treatment with 250 µg/mL of IgA1 together with GB (0.02, 0.05, and 0.1 mg/mL) or MCC950 (1µM). (D, E) The protein levels of caspase-1, NLRP3, and IL-1β were measured using Western blot. **P < 0.01; ***P < 0.001 vs. control; ##P < 0.01; ###P < 0.001 vs. 250 µg/mL of IgA1.
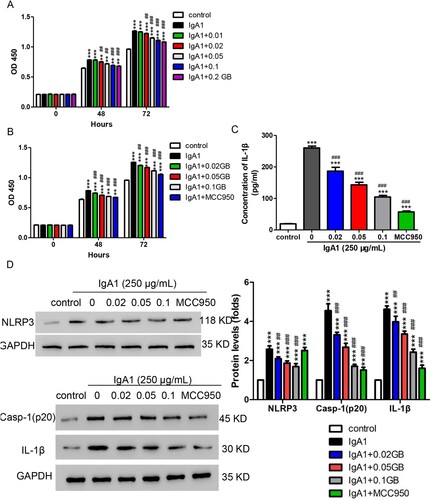
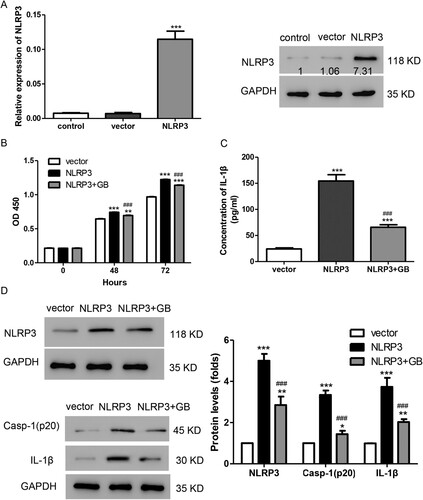
Figure 3. GB alleviated the effects induced by NLRP3 overexpression in HMCs. (A) The mRNA and protein level of NLRP3 were detected by using qPCR (left panel) and Western blot (right panel), respectively. ***P < 0.001 vs. control. (B) HMCs were treated with 0.05 mg/mL of GB together with NLRP3 overexpression plasmid. Cell proliferation was measured by CCK-8 assay. (C) The production of IL-1β was detected by ELISA. (D, E) The protein levels of caspase-1, NLRP3, and IL-1β were measured using Western blot. ***P < 0.001 vs. control; ###P < 0.001 vs. vector.
Supplemental Material
Download TIFF Image (1.1 MB)Data availability statement
The data that support the findings of this study are available in ‘figshare’ [https://figshare.com/] at http://doi.org/10.6084/m9.figshare.16814854, http://doi.org/10.6084/m9.figshare.16814902, http://doi.org/10.6084/m9.figshare.16816087, http://doi.org/10.6084/m9.figshare.19427369.