
Figures & data
Figure 1. Flow chart of the network pharmacology-based study.
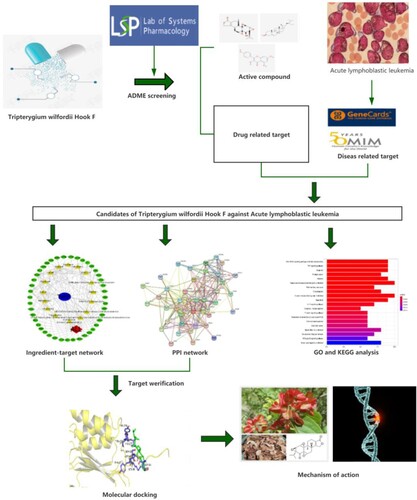
Table 1. Potential effective ingredients of TwHF.
Figure 2. Venn diagram of drug and disease Targets. The blue circle represents the related target of ALL, and the pink circle represents the related target of TwHF. The intersection of two circles represents the target of TwHF in the treatment of ALL, a total of 43.
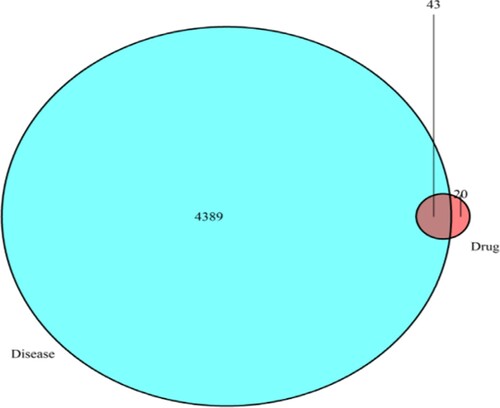
Figure 3. Ingredients-target-disease network of TwHF in the treatment of ALL. The green nodes represent the intersection target gene, the yellow nodes represent the active components. The edges represent the interactions between them.
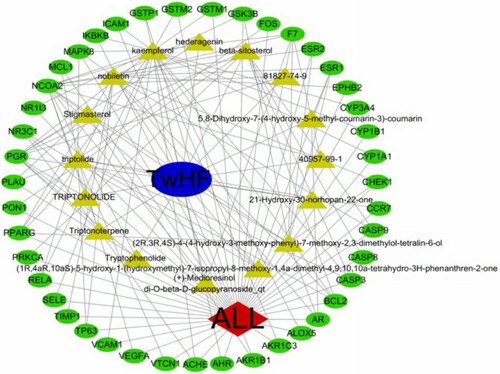
Figure 4. Protein–protein interaction network of TwHF in the treatment of ALL. Nodes represent target genes and proteins, edges represent protein interactions, and the number of connecting lines is directly related to the importance of the target.
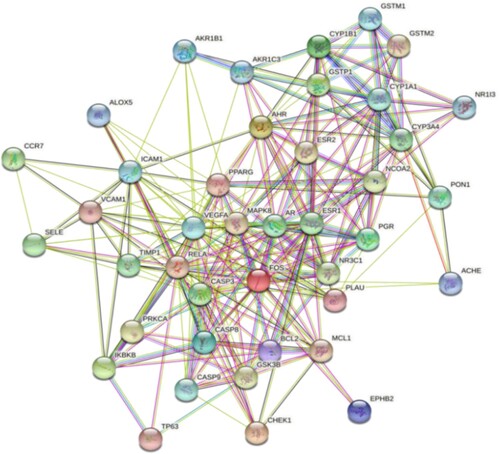
Figure 5. Top 30 key target genes of TwHF in the treatment of ALL by protein-protein interaction analysis. Numbers represent protein–protein interactions, and the size of Abscissa values is directly related to the importance of genes.
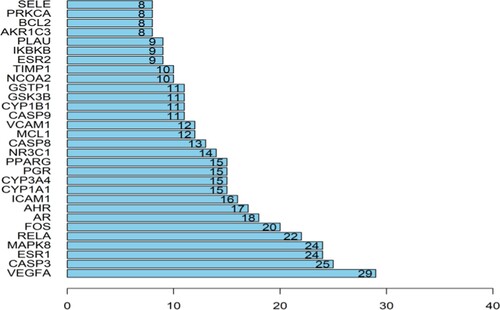
Figure 6. The 20 most significance of gene ontology analysis of therapy target genes of TwHF on ALL. The ordinate is the functional annotation of GO, and the Abscissa is the number of genes enriched in GO, and the enrichment degree and significance are arranged from top to bottom.
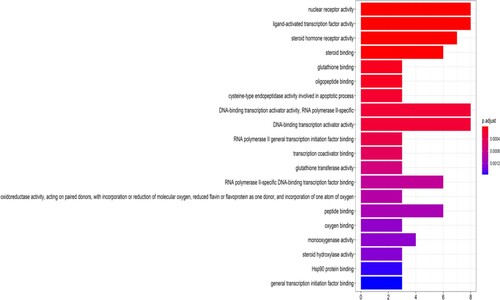
Figure 7. The 20 most significance of pathway enrichment analysis of therapy target genes of TwHF on ALL. The ordinate is the name of KEGG signal pathway, the Abscissa is the proportion of genes, and the enrichment degree and significance are from top to bottom.
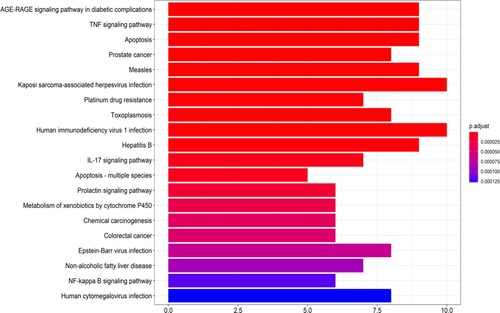
Figure 8. Some molecular docking diagram of active ingredient and corresponding target.
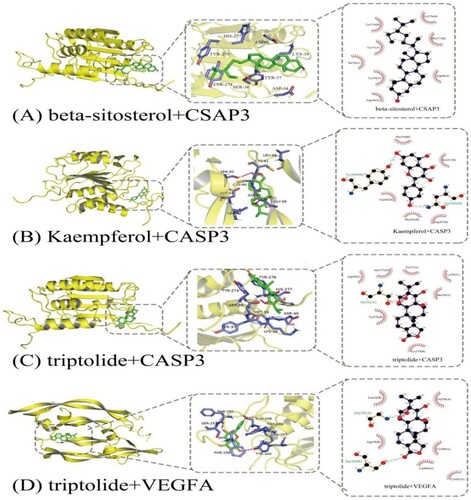
Table 2. Molecular docking results of target and active compounds.
Figure 9. Triptolide inhibited the proliferation of ALL cells. The cell viability of Jurkat (A), MOLT-4 (B) and Nalm-6 (C) cells treated with different concentrations of triptolide (0, 2, 4, 8, 16, 32 and 64 nM) for 24 and 48 h. *P < 0.05 vs the control group.
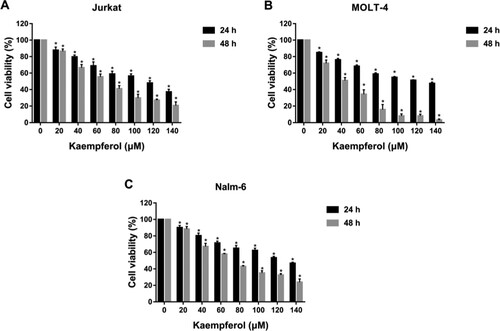
Figure 10. Kaempferol inhibited the proliferation of ALL cells. The cell viability of Jurkat (A), MOLT-4 (B) and Nalm-6 (C) cells treated with different concentrations of kaempferol (0, 20, 40, 60, 80, 100, 120 and 140 μM) for 24 and 48 h. *P < 0.05 vs the control group.
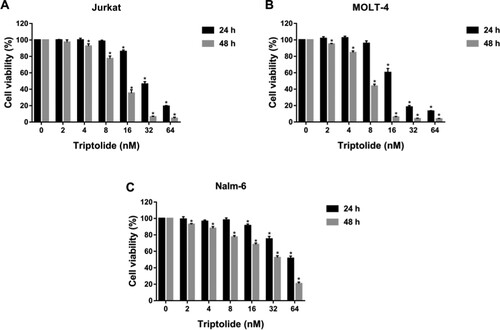
Table 3. The IC50 values of Triptolide and Kaempferol on Jurkat, MOLT-4 and Nalm-6 cells for 48 h.
Data availability statement
The data that support the findings of network pharmacology and molecular docking are available in TCMSP at http://tcmspw.com/tcmsp.php,in Uniport at https://www.uni.protorg/, in GeneCards at https://www.genecards.org/, in OMIM at https://omim.org/, in STRING at https://string-db.org/, in Bioconductor at https:// www.bioconductor.org/, in PubChem at http://pubchem.ncbi.nim.nih.gov/, in PDB at https://www.rcsb.Org/. The data that support the findings of cell viability experiments are available in the figshare repository at https://doi.org/10.6084/m9.figshare.21159064.