
Figures & data
Figure 1. Variation in ambient temperature and precipitation during field experiment.
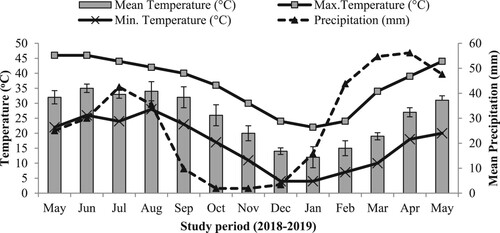
Figure 2. Spatial distribution of sample plots and field incubation sites in the HM forest.
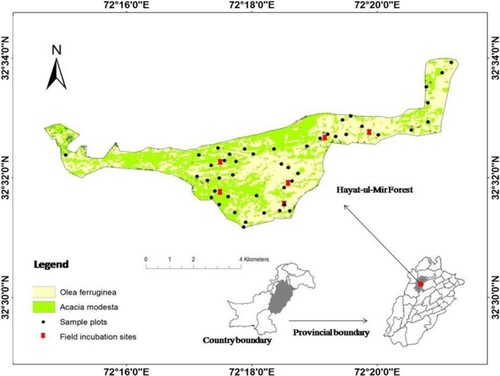
Figure 3. Effect of elevation on litter decomposition dynamics in the field; (a) mass loss and residual weight, (b) half life and decay rate and (c) remaining C, N and C:N.
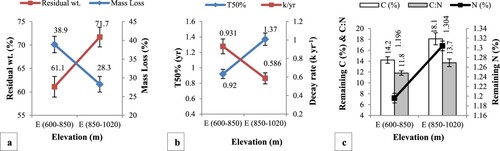
Table 1. Correlation analysis of site elevation with litter decomposition dynamics.
Figure 4. Effect of incubation time on litter decomposition dynamics in the field; (a) mass loss and residual weight, (b) half life and decay rate and (c) remaining C, N and C:N. Bars and lines with different letters indicate significant difference at p < .05 based on Tukey HSD test.
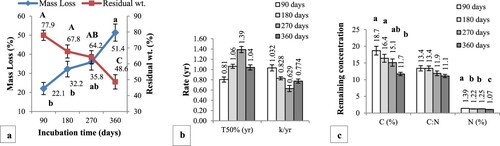
Table 2. Univariate analysis of variance with effect of temperature (n = 3), soil moisture (n = 2) and time (n = 3) on litter decomposition dynamics in microcosms.
Figure 5. Effect of incubation temperature (a–c), time (d–f) and soil moisture (g–i) on litter decomposition dynamics during microcosm experiment. Bars and lines with different letters indicate significant difference at p < .05 based on Tukey HSD test.
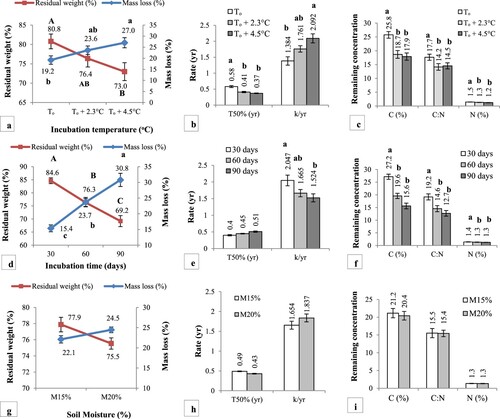
Figure 6. Main effect of incubation temperature, time and soil moisture on soil respiration. Bars with different letters differ significantly at p < .05 based on Tukey HSD.
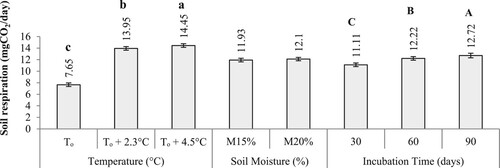
Table 3. Multiple comparison of effect of treatments on soil respiration (mgCO2/day) in the microcosms.
Supplemental Material
Download MS Word (27.5 KB)Data availability statement
The data supporting the findings of this study are available Mendeley Data, V1, DOI: 10.17632/tkddkcv6sf.1 (https://data.mendeley.com/datasets/tkddkcv6sf/1).