
Figures & data
Figure 1. Map of fruit shape at different stages of development after pollination. Pollination tree; B. 60 d; C. 90 d; D. 120 d.
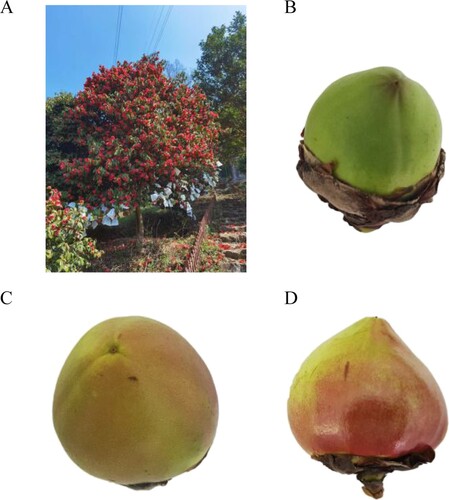
Figure 2. Change of content in auxin between seed kernel and pericarp. A. IAA; B. ME-IAA; C. IBA; D. ICA; E. ICAld. Data represent the average of three replicates (n = 3) ± standard erro r. Different letters indicate significant differences by Duncan’s Multiple Range Test at p ≤ 0.05.
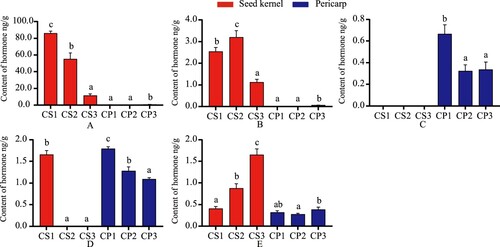
Figure 3. Change of content in CTK between seed kernel and pericarp. A. tZ; B. IP. Data represent the average of three replicates (n = 3) ± standard error. Different letters indicate significant di fferences by Duncan’s Multiple Range Test at p ≤ 0.05.
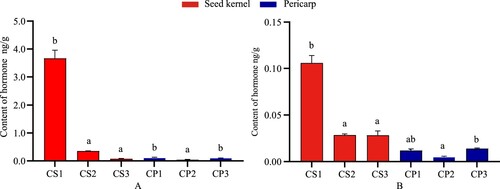
Figure 4. Change of content in GAs between seeds kernel and pericarp. A. GA1; B. GA3; C. GA4; D. GA7; E. GA9; F. GA15; G. GA19; H. GA20; I. GA24; J. GA53. Data represent the average of three replicates (n = 3) ± standard erro r. Different letters indicate significant di fferences by Duncan’s Multiple Range Test at p ≤ 0.05.
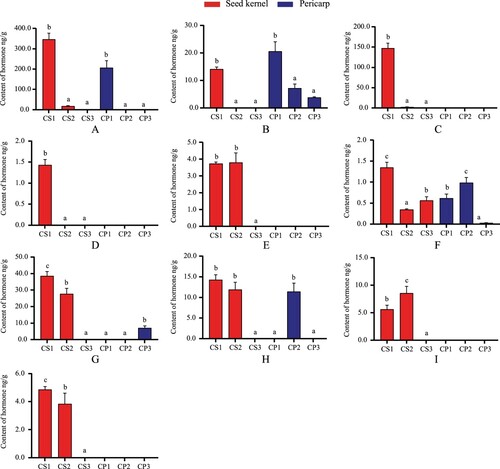
Figure 5. Change of content in ABA between seed kernel and pericarp. Data represent the average of three replicates (n = 3) ± standard erro r. Different letters indicate significant differences by Duncan’s Multiple Range Test at p ≤ 0.05.
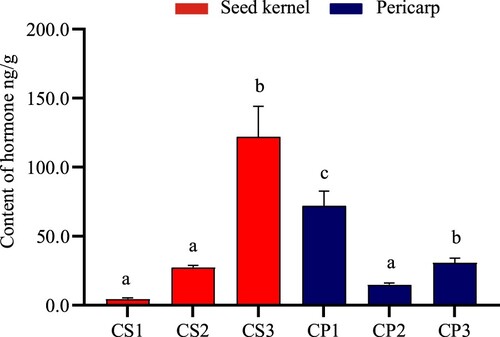
Figure 6. Change of content in JAs between kernel and pericarp. A. JA; B. MEJA; C. JA-ILE; D. H2JA. Data represent the average of three replicates (n = 3) ± standard erro r. Different letters indicate significant differences by Duncan’s Multiple Range Test at p ≤ 0.05.
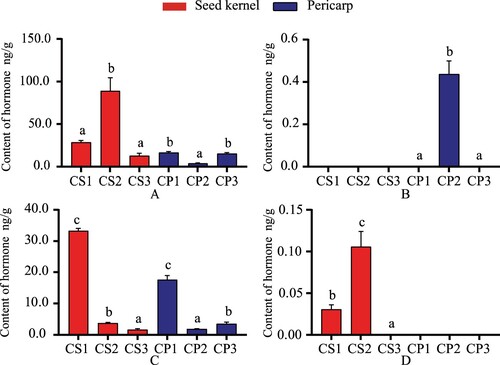
Figure 7. Change of content in SA between seed kernel and pericarp. Data represent the average of three replicates (n = 3) ± standard erro r. Different letters indicate significant di fferences by Duncan’s Multiple Range Test at p ≤ 0.05.
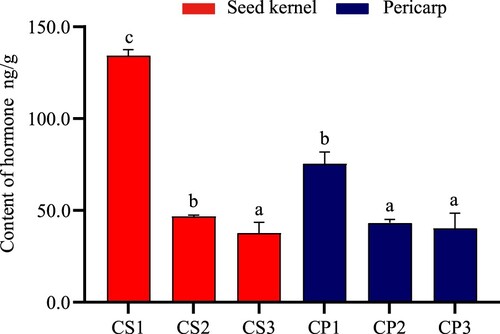
Figure 8. Change of ratio in (Auxin + Cytokinin + Gibberellin) /ABA. Data represent the average of three replicates (n = 3) ± standard error. Different letters indicate significant di fferences by Duncan’s Multiple Range Test at p ≤ 0.05.
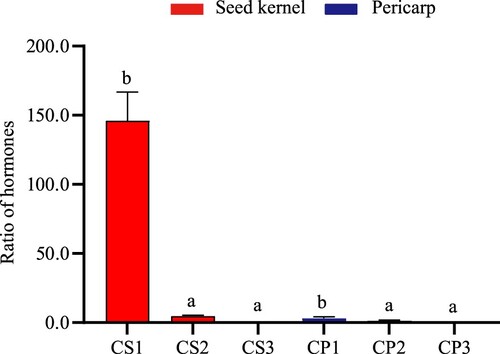
Table 1. The correlation of various hormone between seed kernel and pericarp in C. chekiangoleosa
Supplemental Material
Download Zip (24.9 KB)Data availability statement (DAS)
Data for the manuscript is available at https://dx.doi.org/10.6084/m9.figshare.21220898