
Figures & data
Figure 1. Heart imaging picture. A, B. Echocardiography revealed that the left anterior ventricular wall was mainly hypertrophy. C, D. MRI showed that the anterior wall thickness of the basal segment of the left ventricle was 14.8 mm, and the thickness of the interventricular septum was 12.6 mm. The anterior and inferior walls of the left ventricle are thickened asymmetrically. E, F. Pathological tissue biopsy revealed hypertrophy of myocardial cells, multifocal fibrous hyperplasia in the myocardium, and a small amount of adipose tissue.
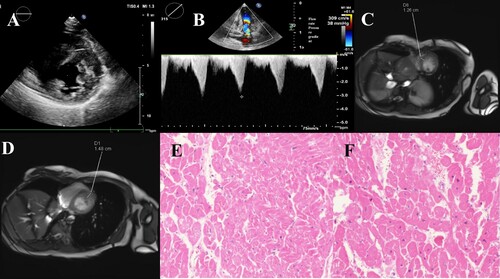
Figure 2. Sanger sequencing results and homology comparison. A. Sanger sequencing result of the proband. B. the result of normal human Sanger sequencing. C. Homology alignment of missense mutation sites
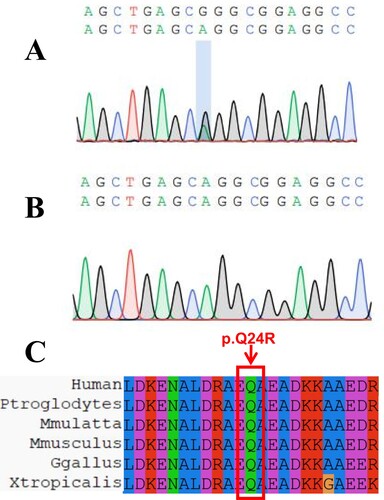
Figure 3. Simulation of TPM1 protein important region and prediction of 3D structure. A. the region where the mutation site is located. B. Prediction of the 3D structure of the protein after mutation in the proband. C. Prediction of the 3D structure of the protein in the control group.
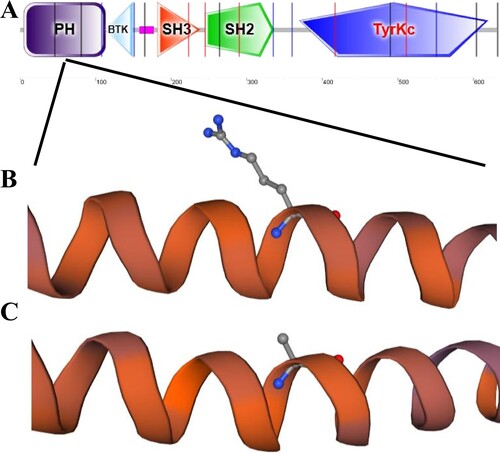
Figure 4. Function and pathway enrichment analysis. A. GO function enrichment analysis of TPM1 related interaction genes. B, C. Enrichment analysis of KEGG pathway related to TPM1 interacting genes.
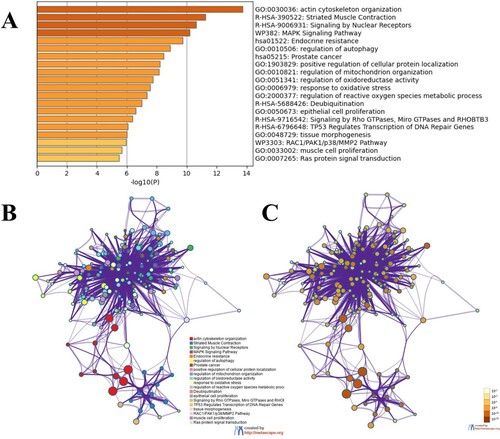
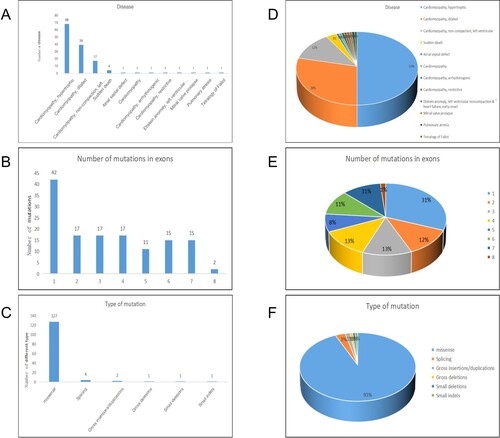
Figure 5. Summary and analysis of all mutations. A, D are classified according to the type of disease, the number and proportion of mutations in different diseases. B, E are classified according to the exons where the mutation sites are located, and the number and proportion of mutations in different exons. C, F are classified by mutation type, the number and proportion of mutations of different mutation types.
Data availability
Additional supporting data is not publicly available to protect patient privacy.